Milvaion UI Screenshots
This page provides a visual tour of the Milvaion Dashboard, showcasing its key features and interfaces.
All screenshots on this page are captured in dark mode. The dashboard also supports light mode.
Overview
The main dashboard provides a comprehensive view of your job scheduling system at a glance.
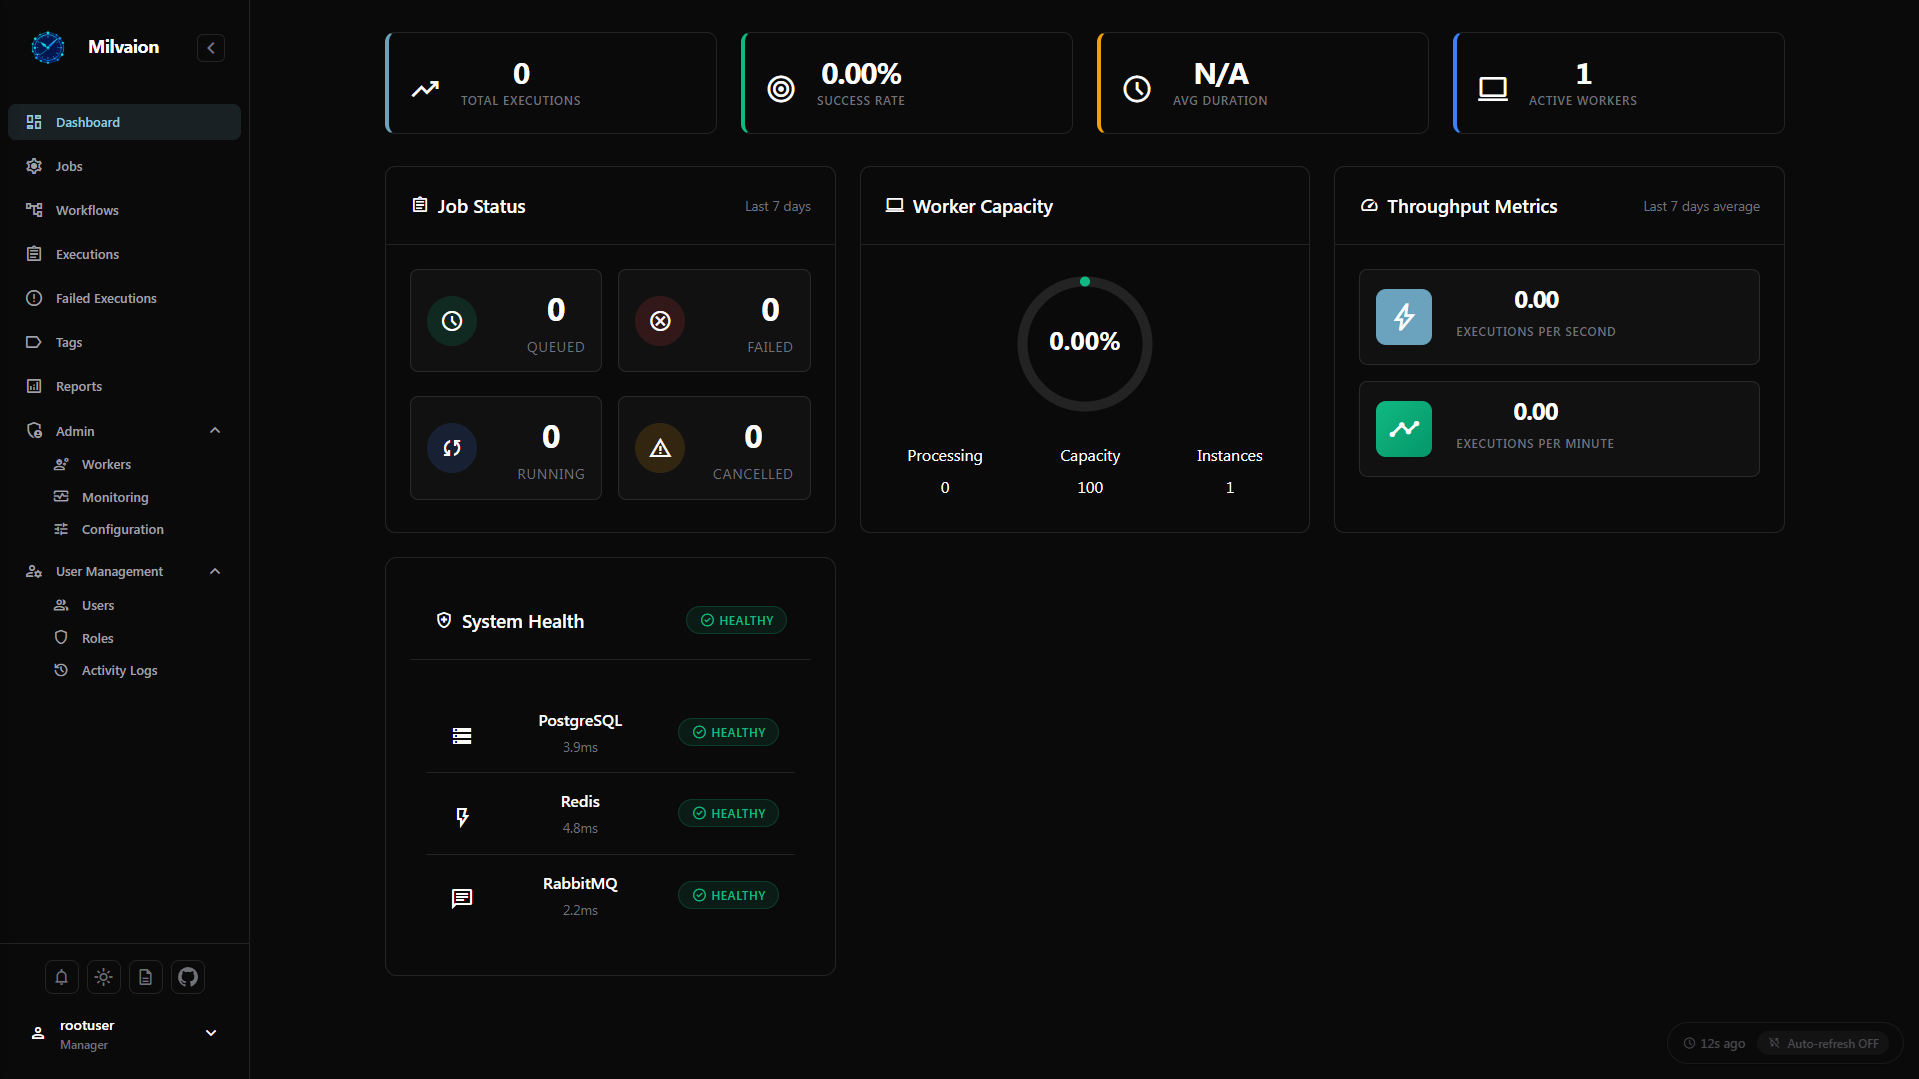
Key elements:
- Total executions and success rate
- Active workers and capacity utilization
- Queued, running, and completed jobs
- Executions per minute metrics
- System health
Jobs Management
Job List View
Browse all scheduled jobs with filtering capabilities.
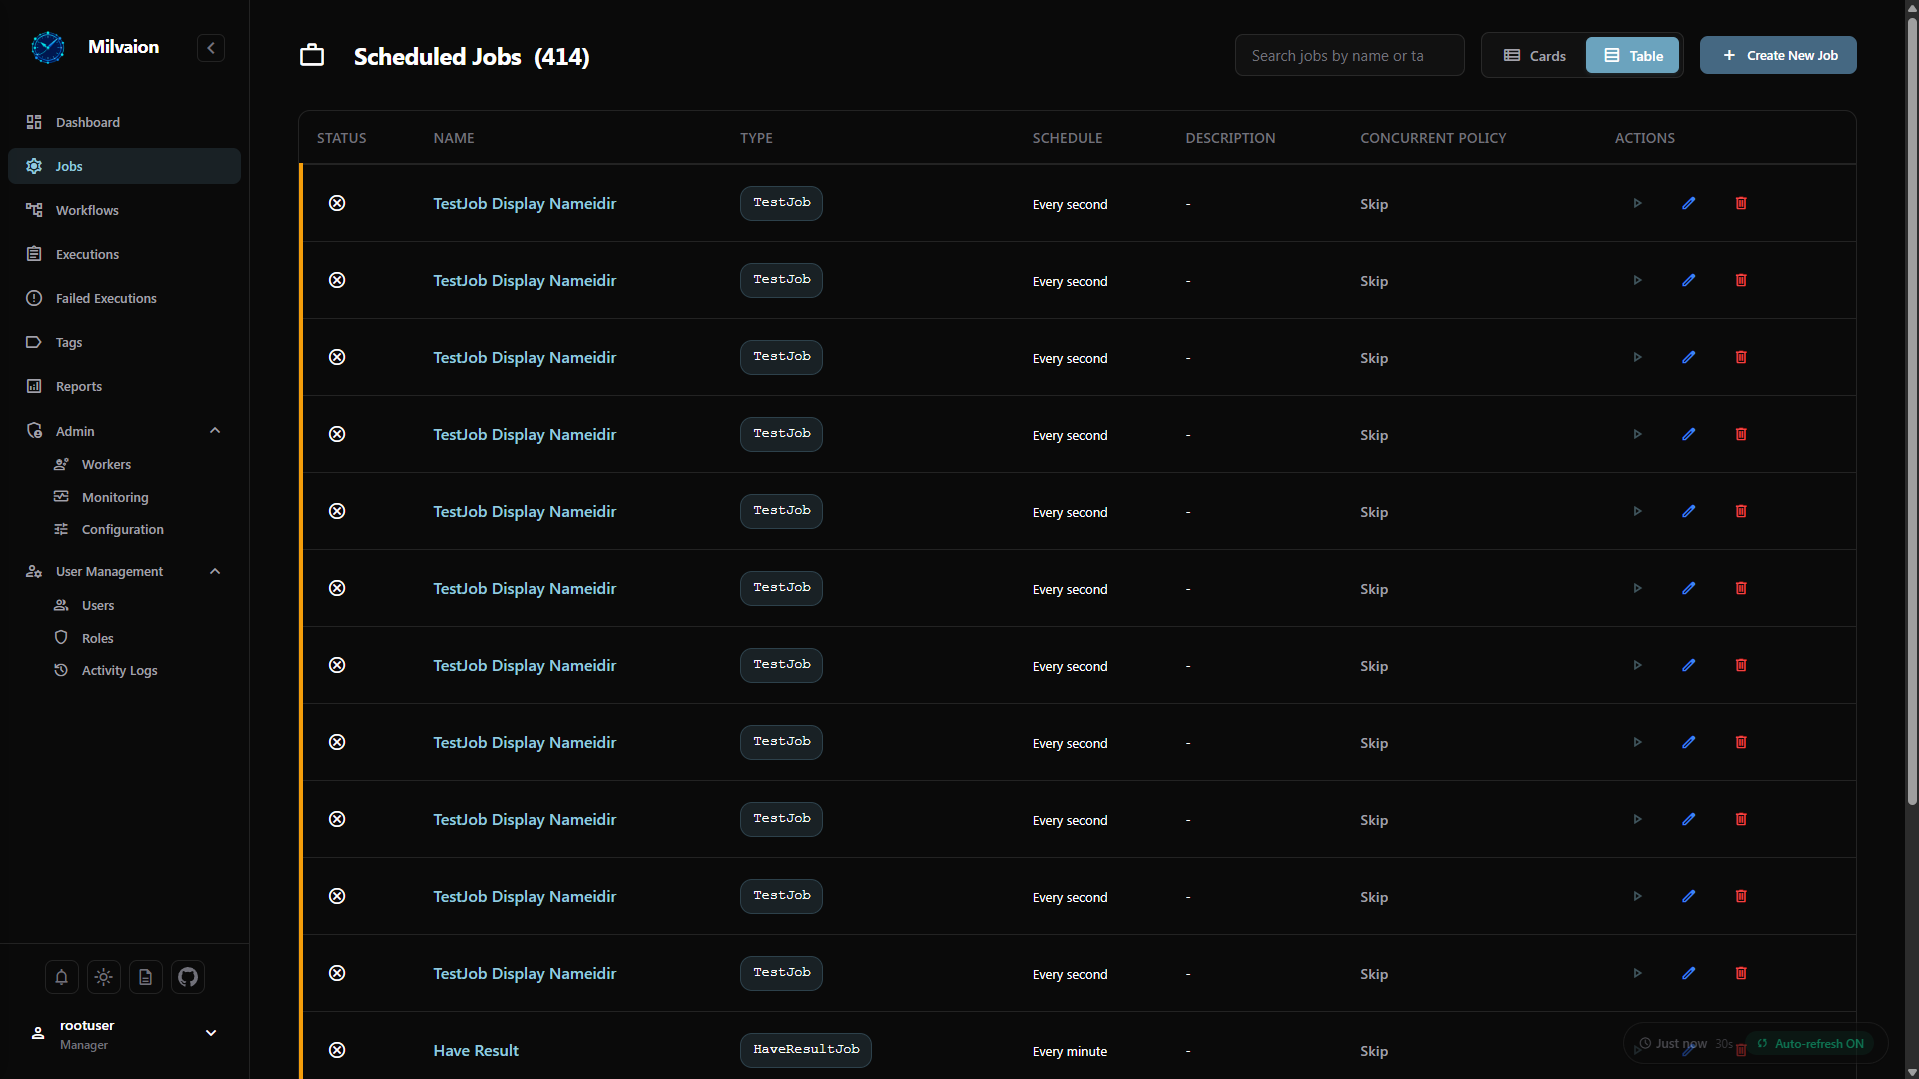
Features:
- Filter by status (Active, Disabled, Deleted)
- Search by job name or type
- Quick actions (Enable/Disable, Trigger, Edit, Delete)
Job Details
View comprehensive information about a specific job.
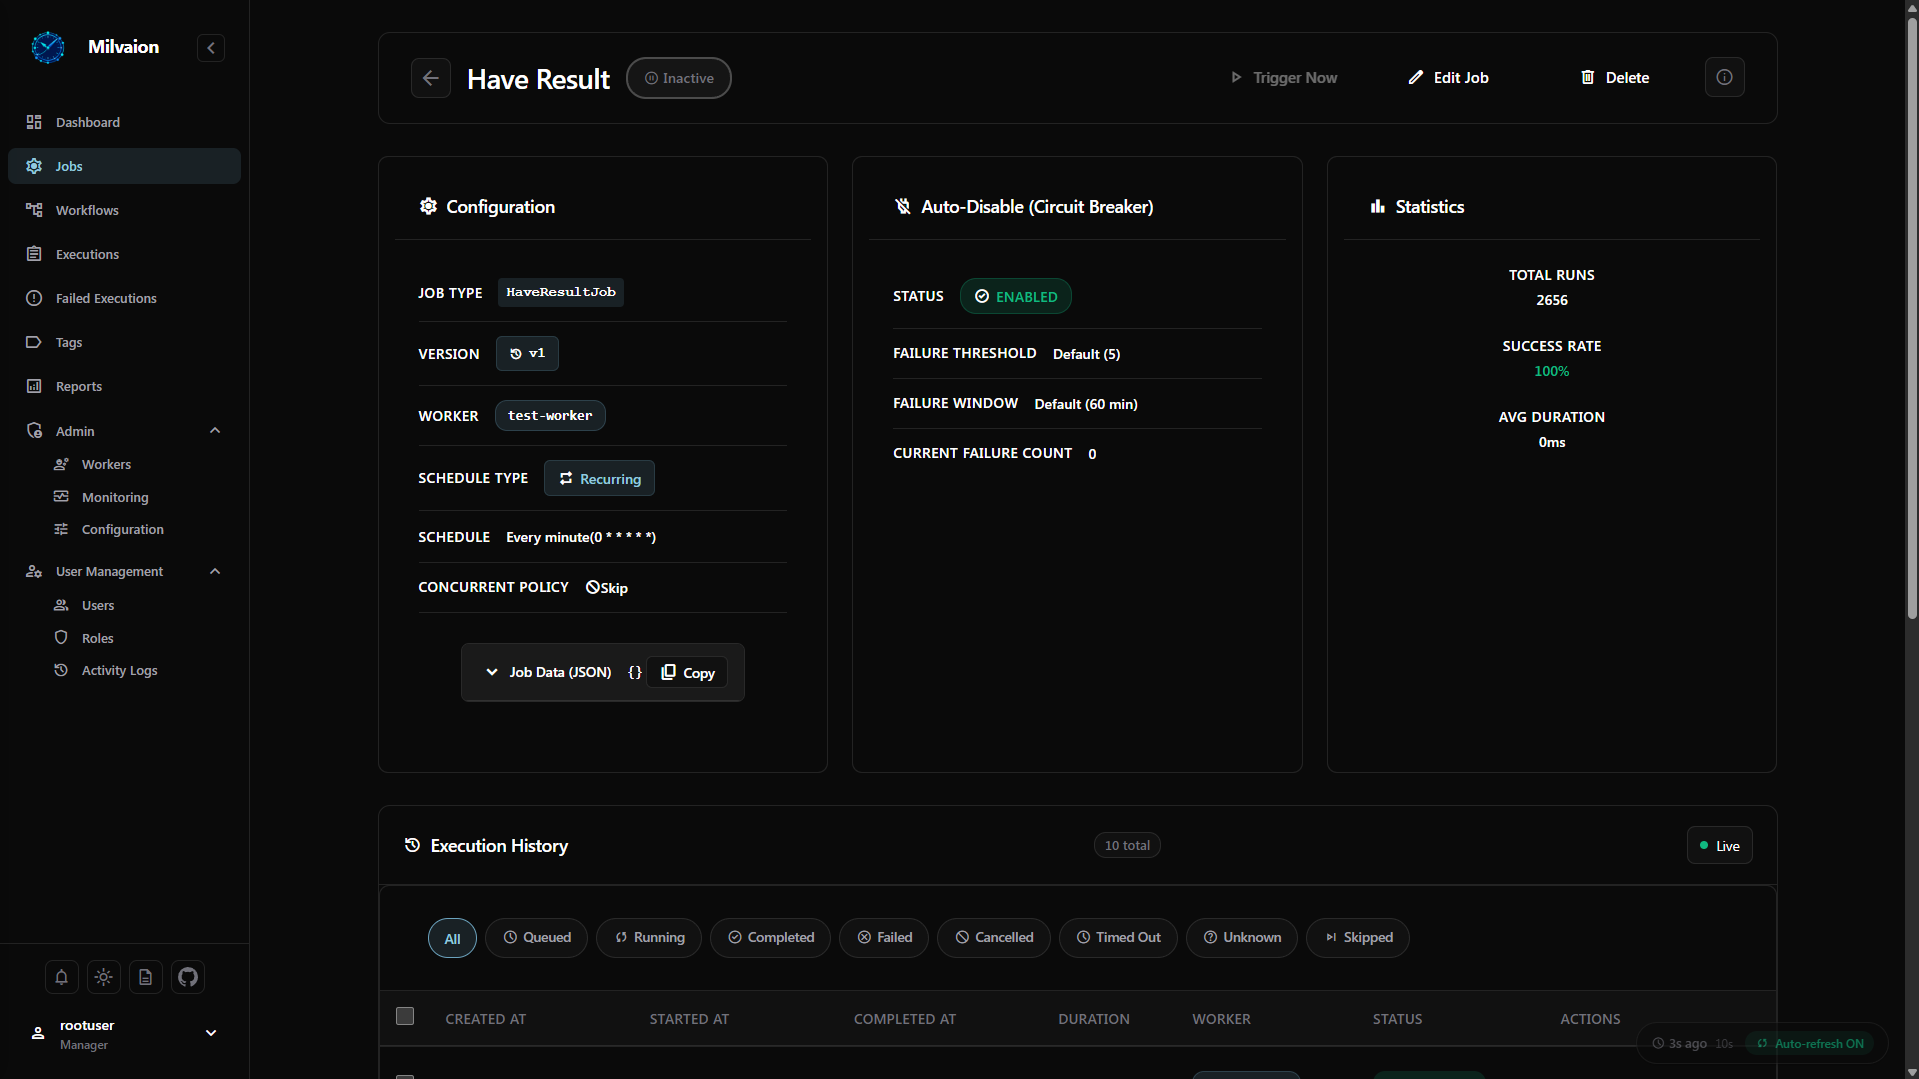
Information displayed:
- Job configuration (cron expression, timeout, retries)
- Execution history
- Recent occurrences with status
Create / Edit Job
Create new jobs or modify existing ones through an intuitive form.
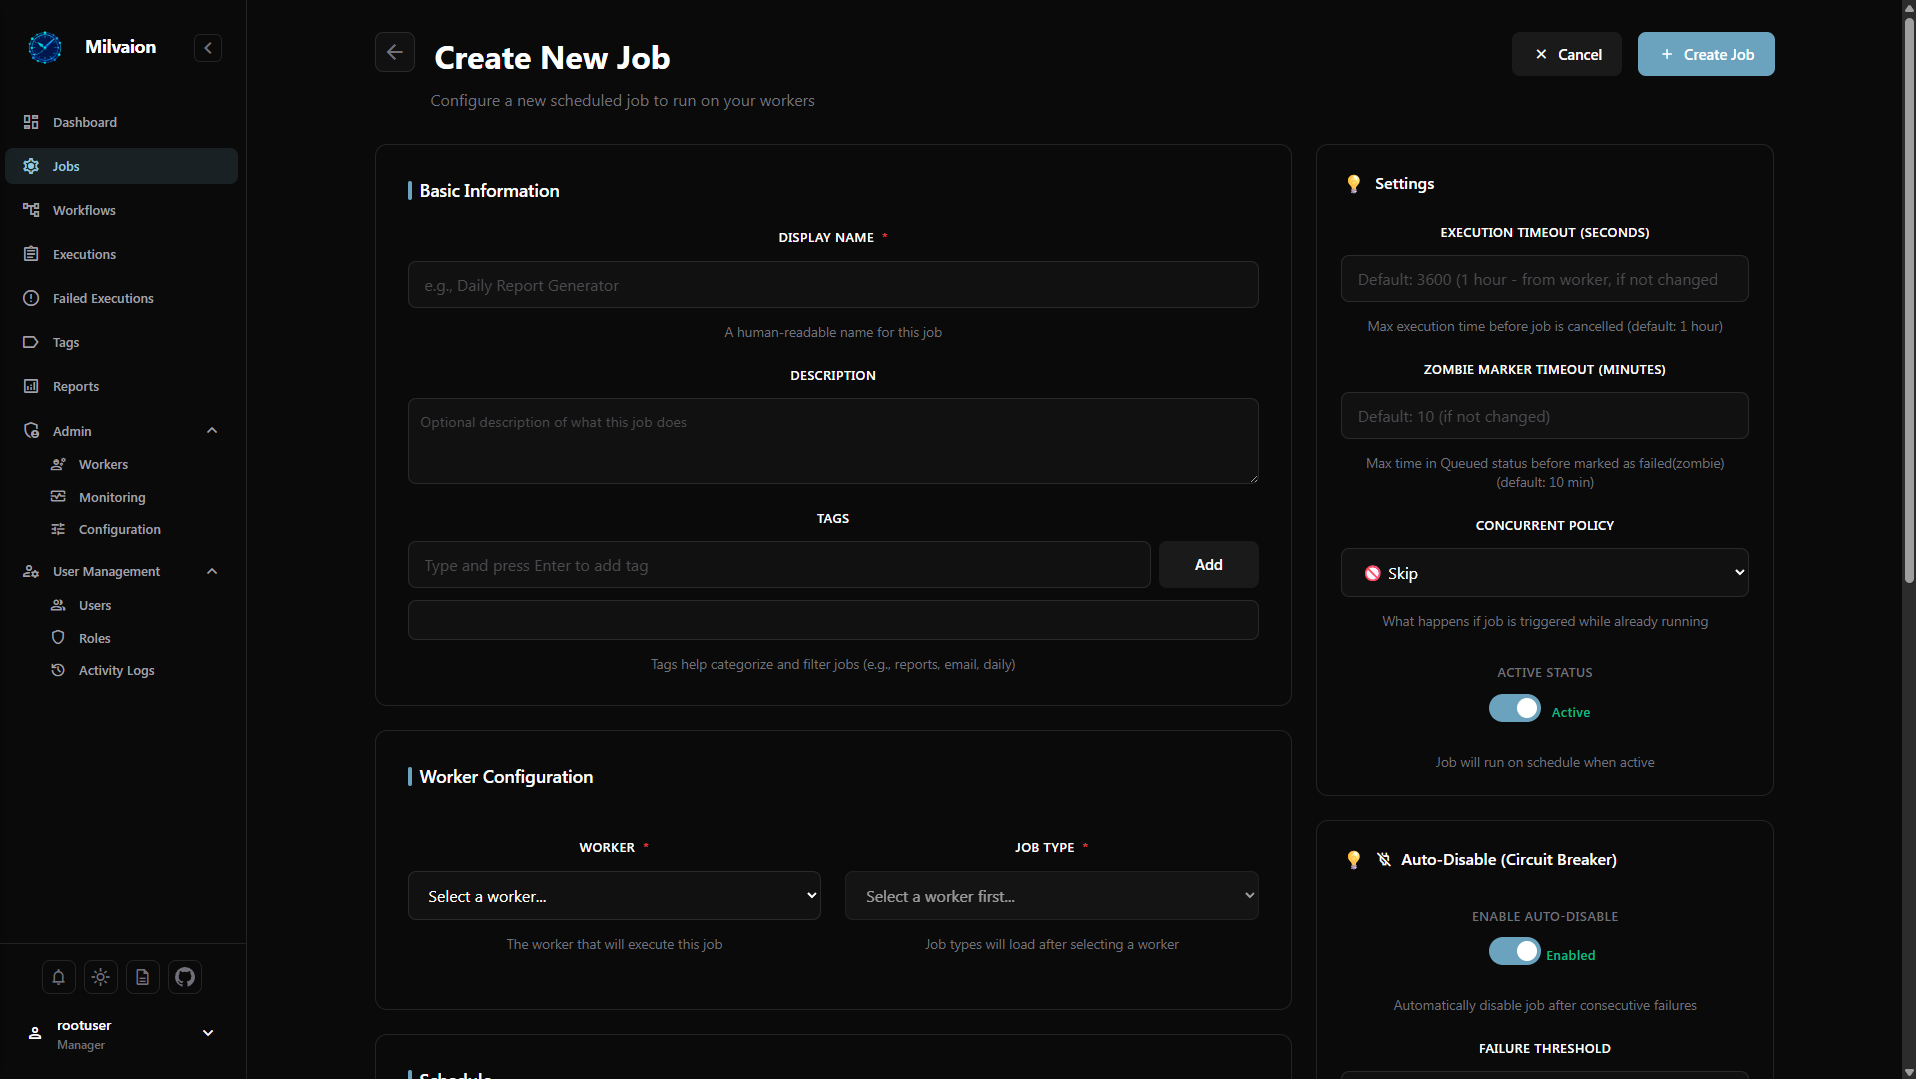
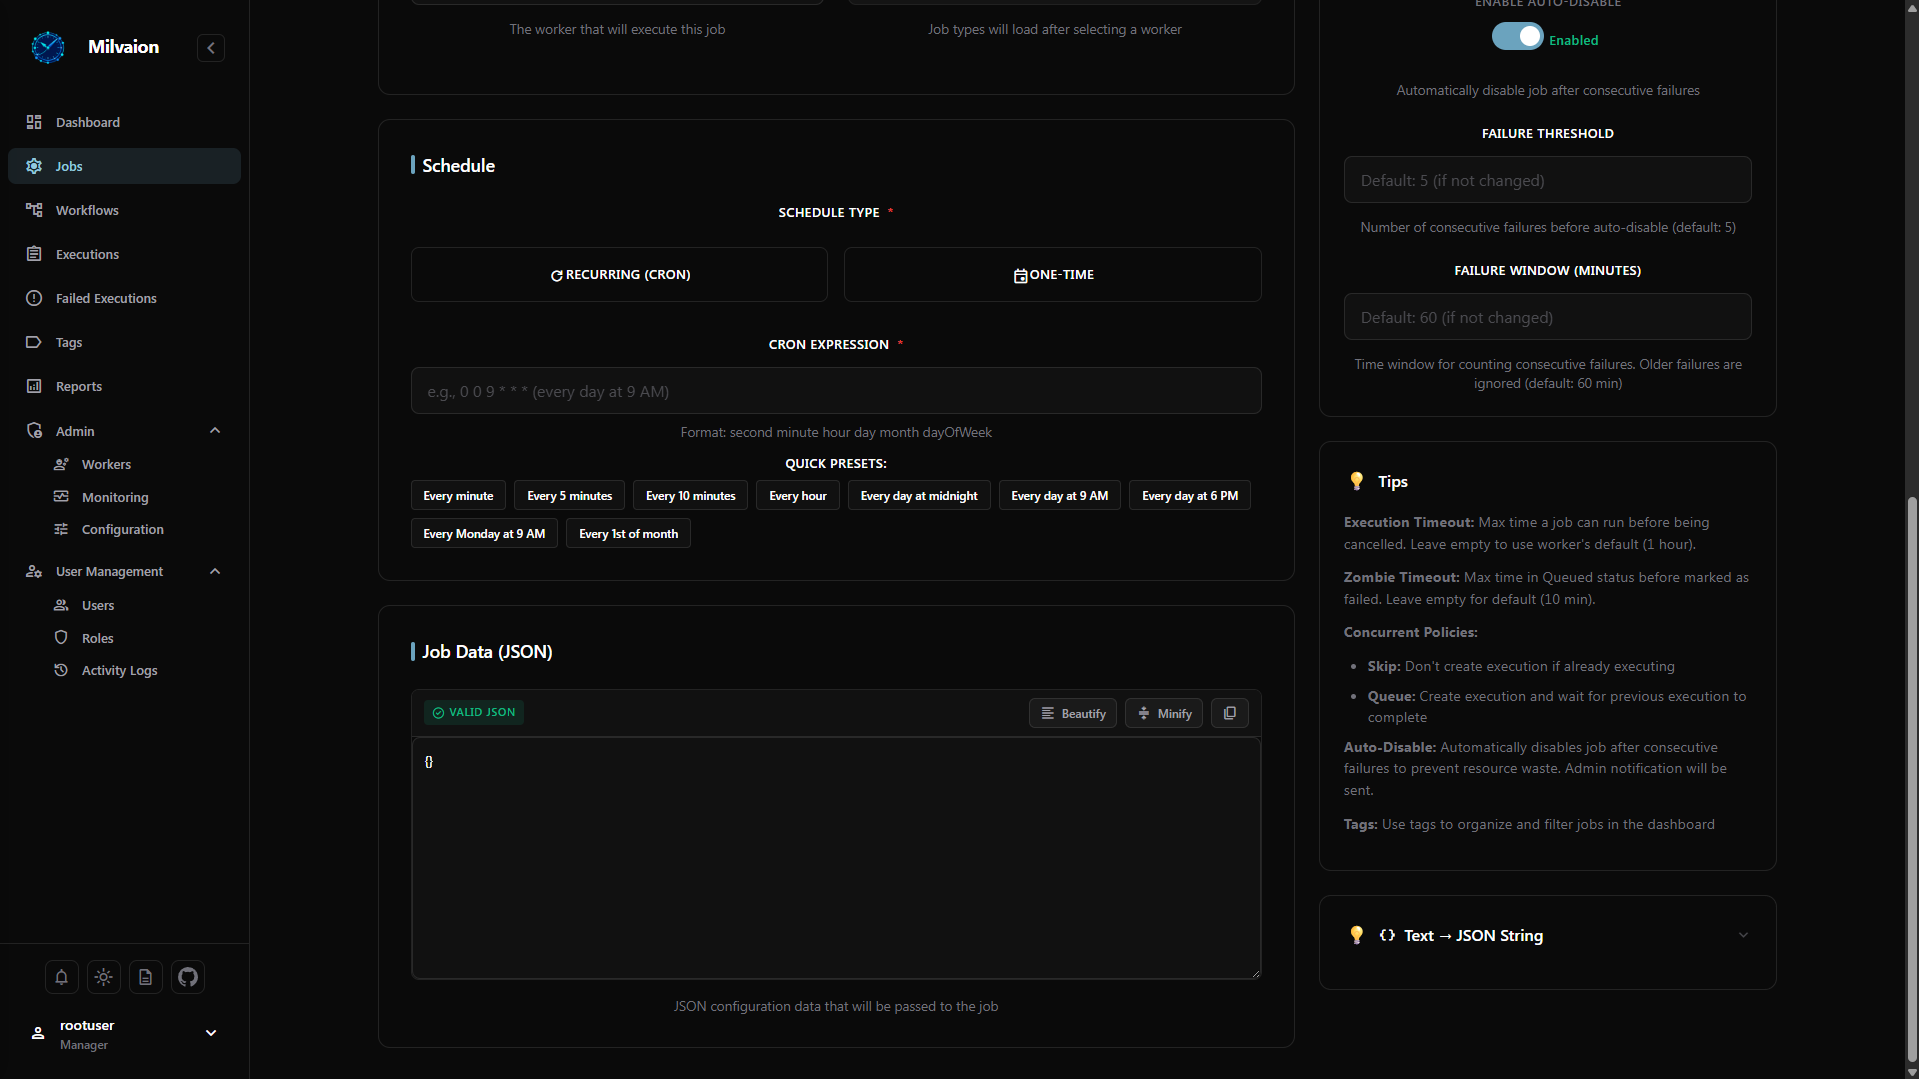
Configuration options:
- Job type selection (autofill workers and job types)
- Job data schema definition (autofill from worker)
- Cron expression builder with preview
- Job data (JSON payload)
- Timeout and retry settings
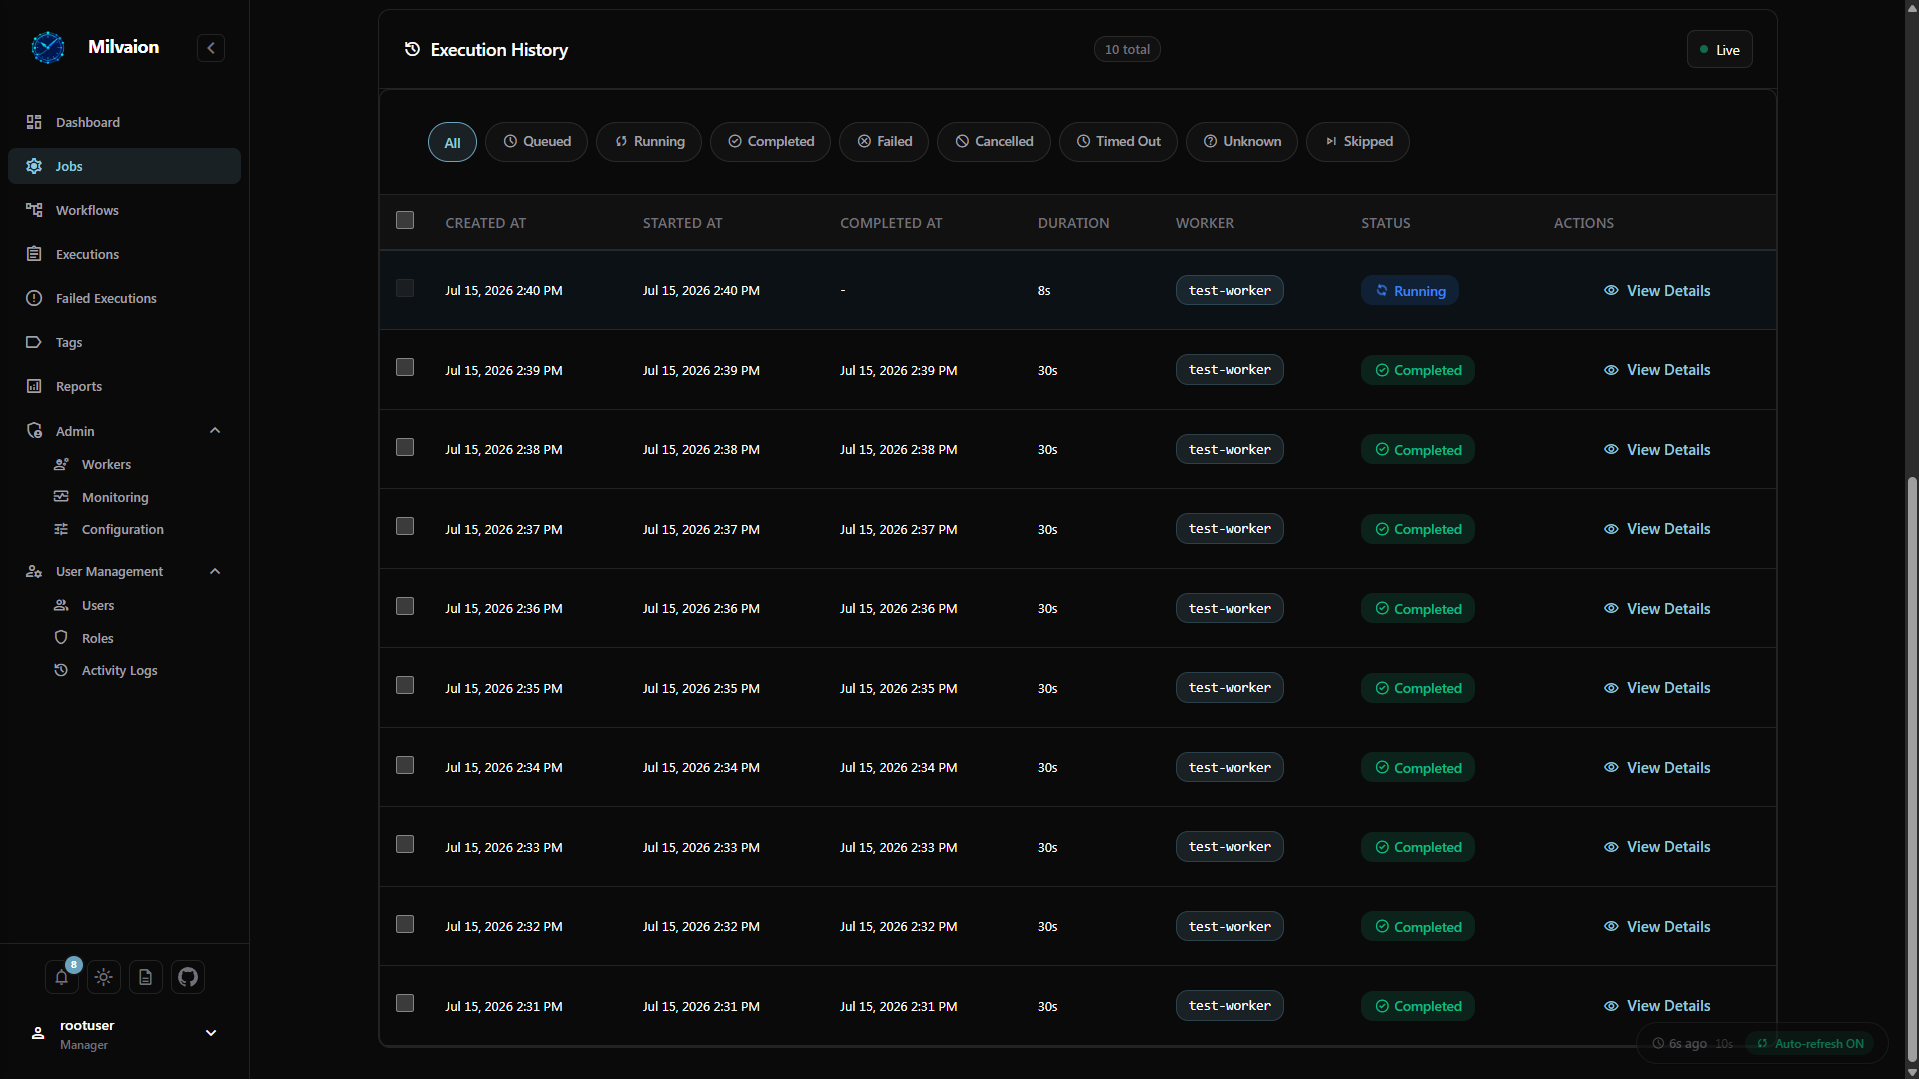
Occurrences
Occurrence List
View all job executions with detailed status information.
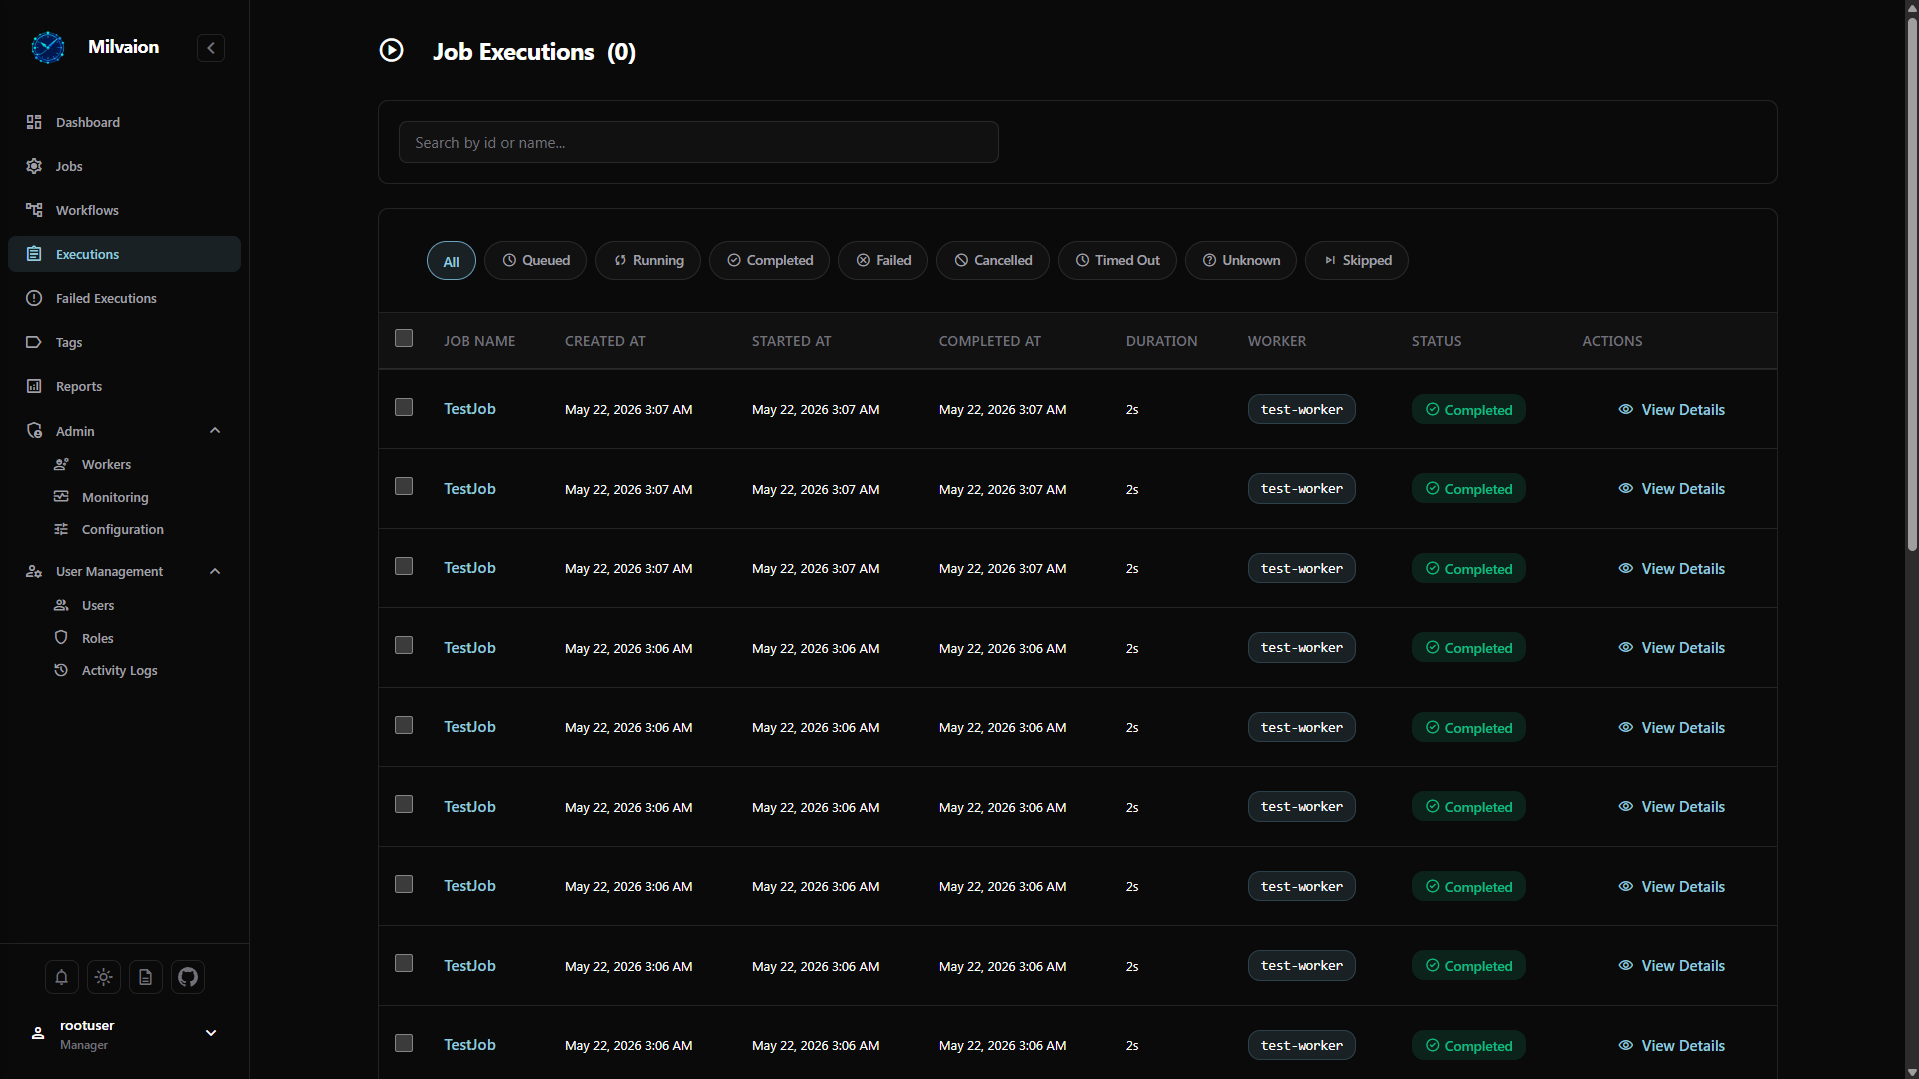
View execution creations and updates in real-time.
Occurrence Details
Drill down into a specific execution for troubleshooting.
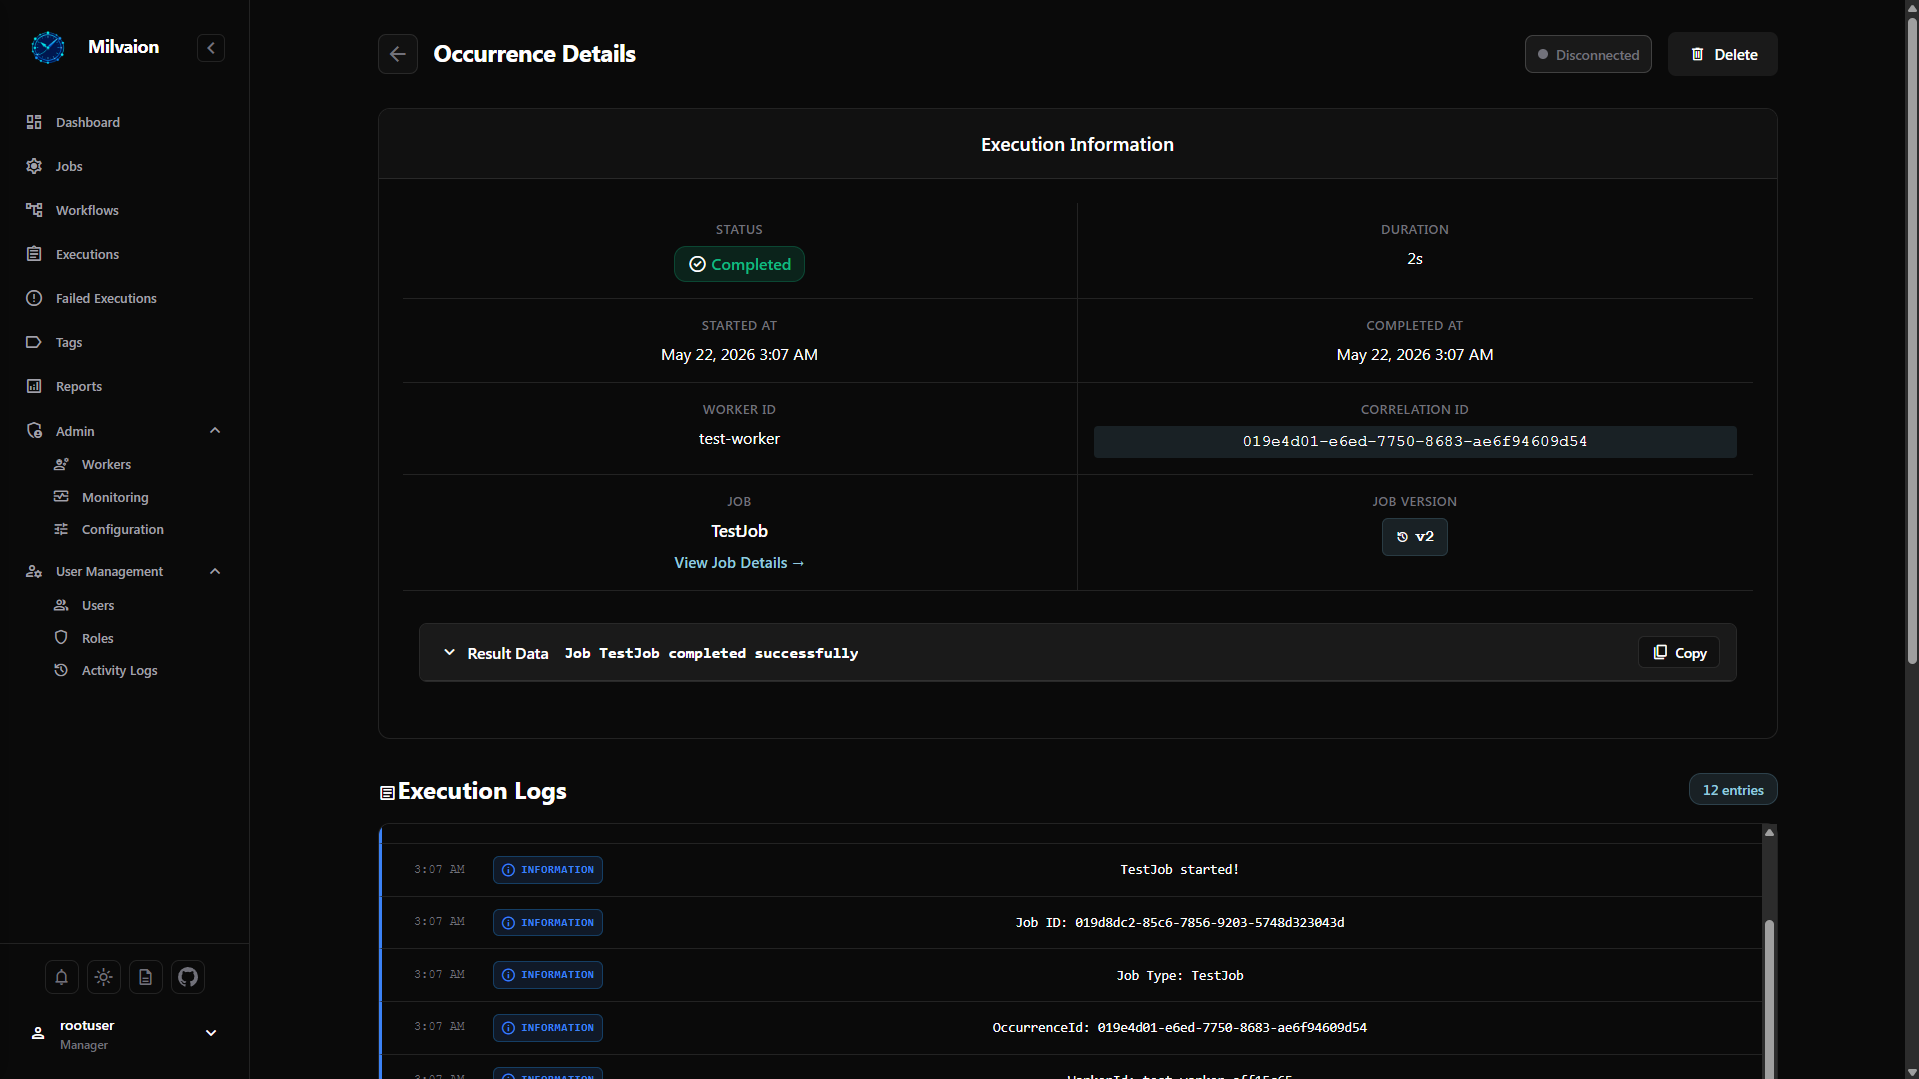
Details included:
- Execution timeline
- User-friendly logs
- Status change history
- Error details and stack trace (for failed jobs)
- Job data snapshot
Occurrence Logs
View execution logs for debugging and monitoring.
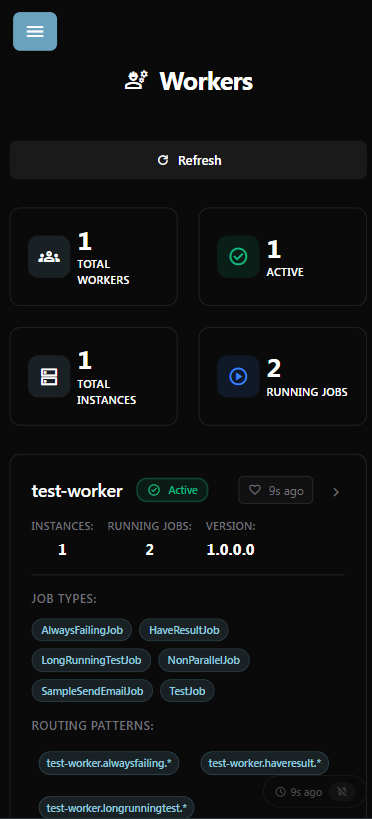
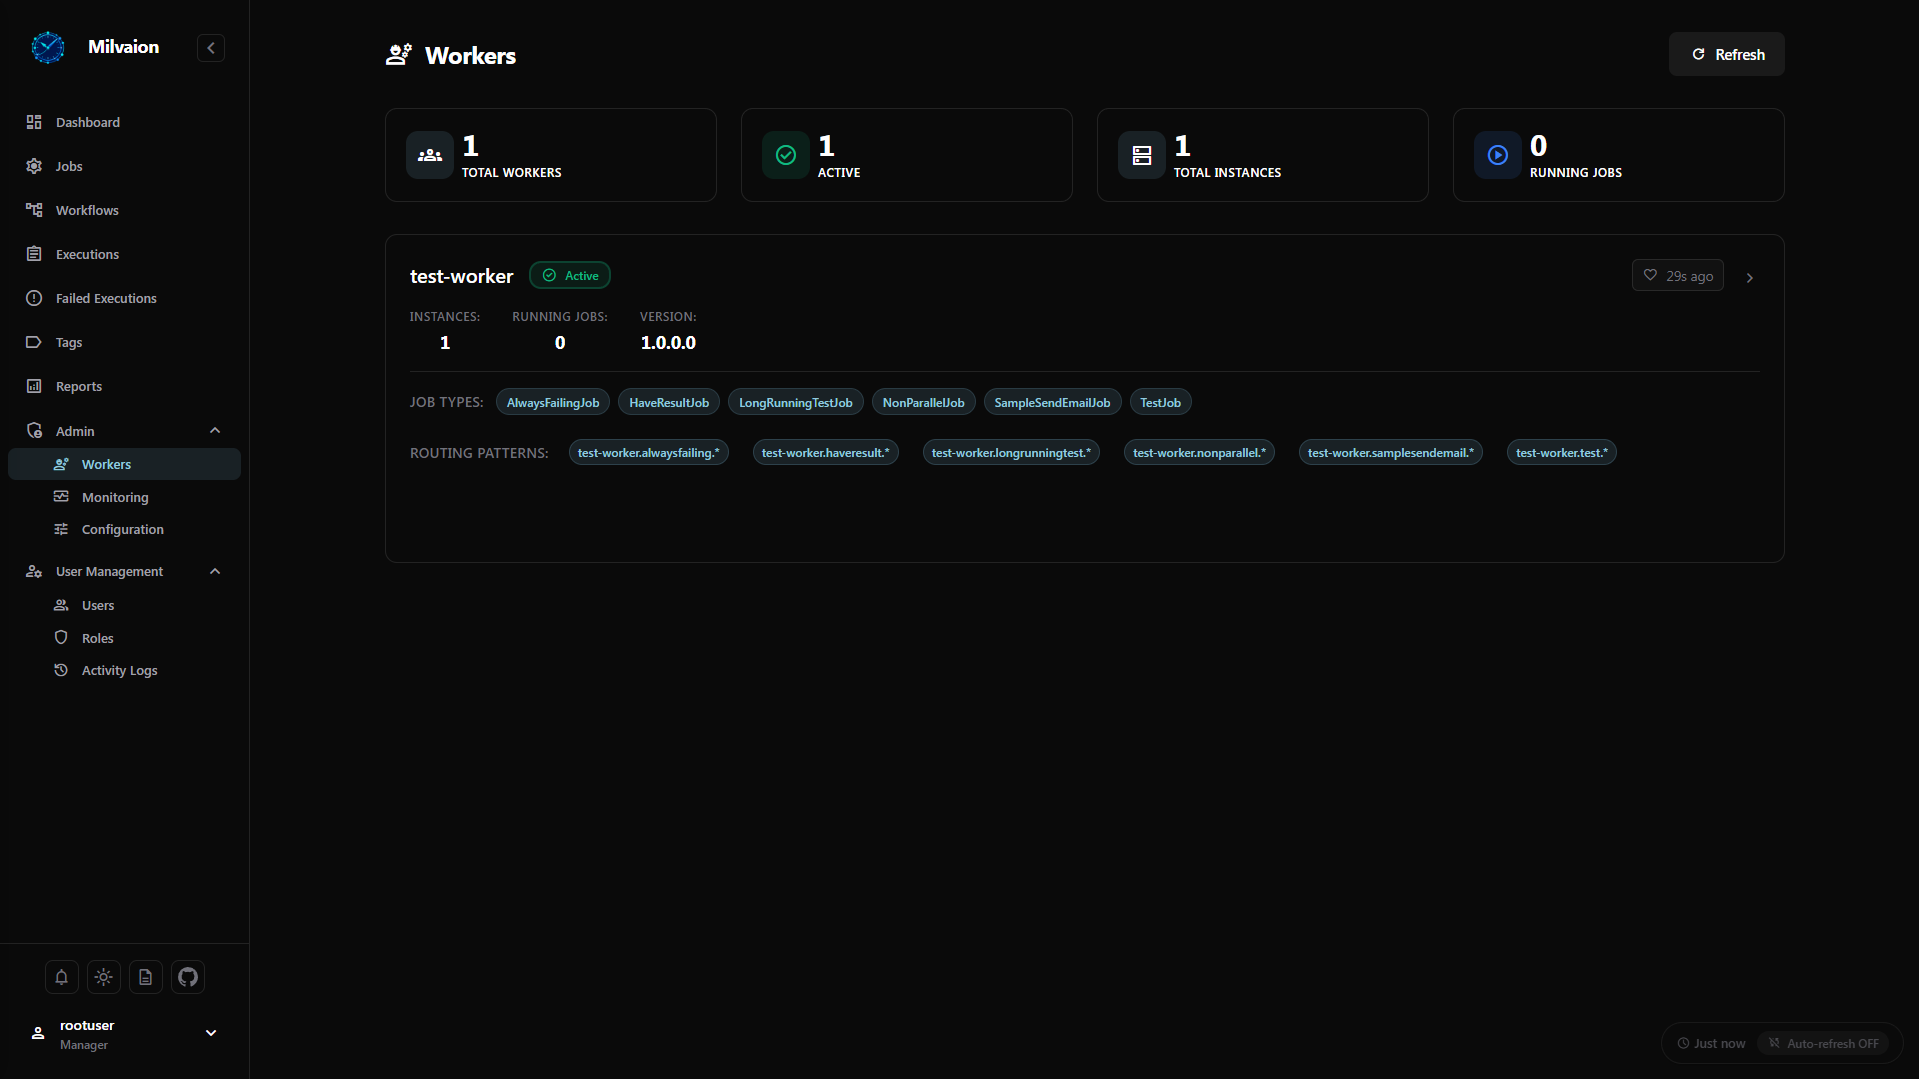
Workers
Worker List
Monitor all registered workers and their health status.
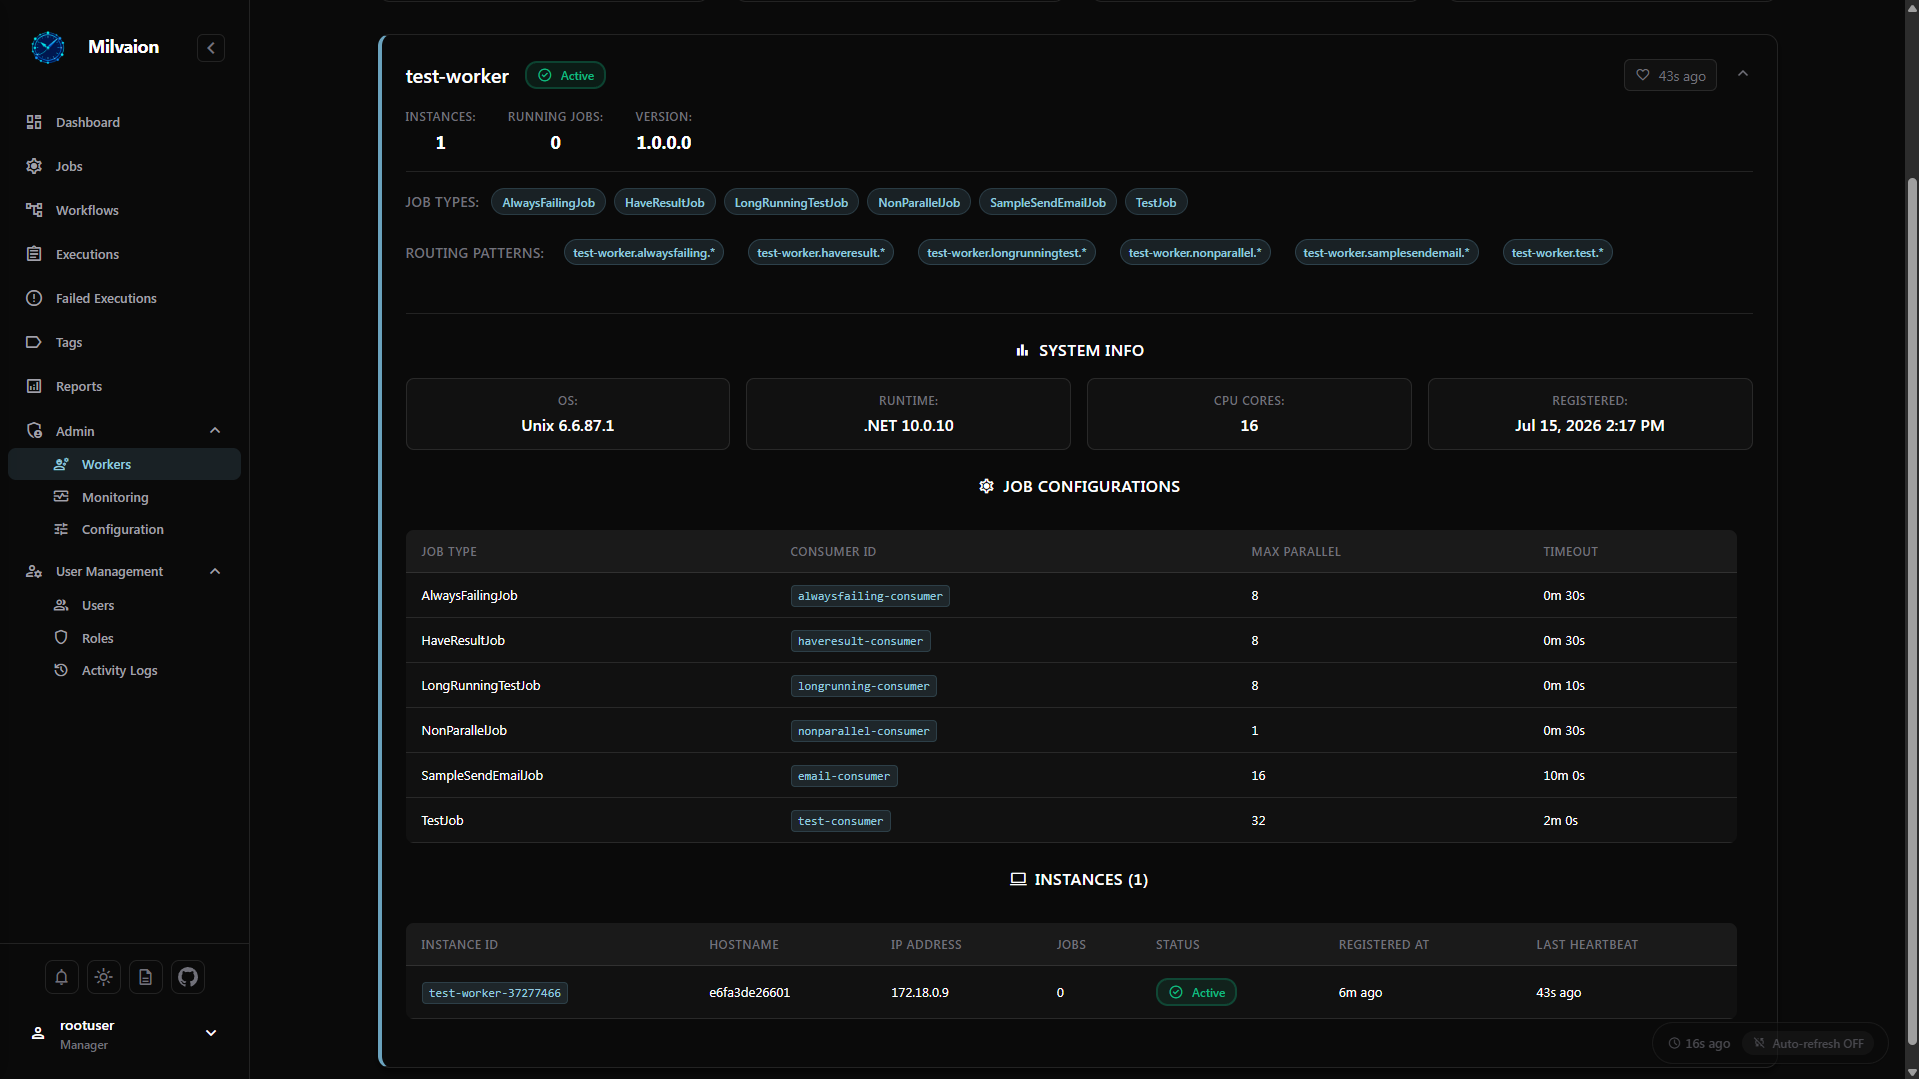
Worker Details
View detailed information about a specific worker instance.
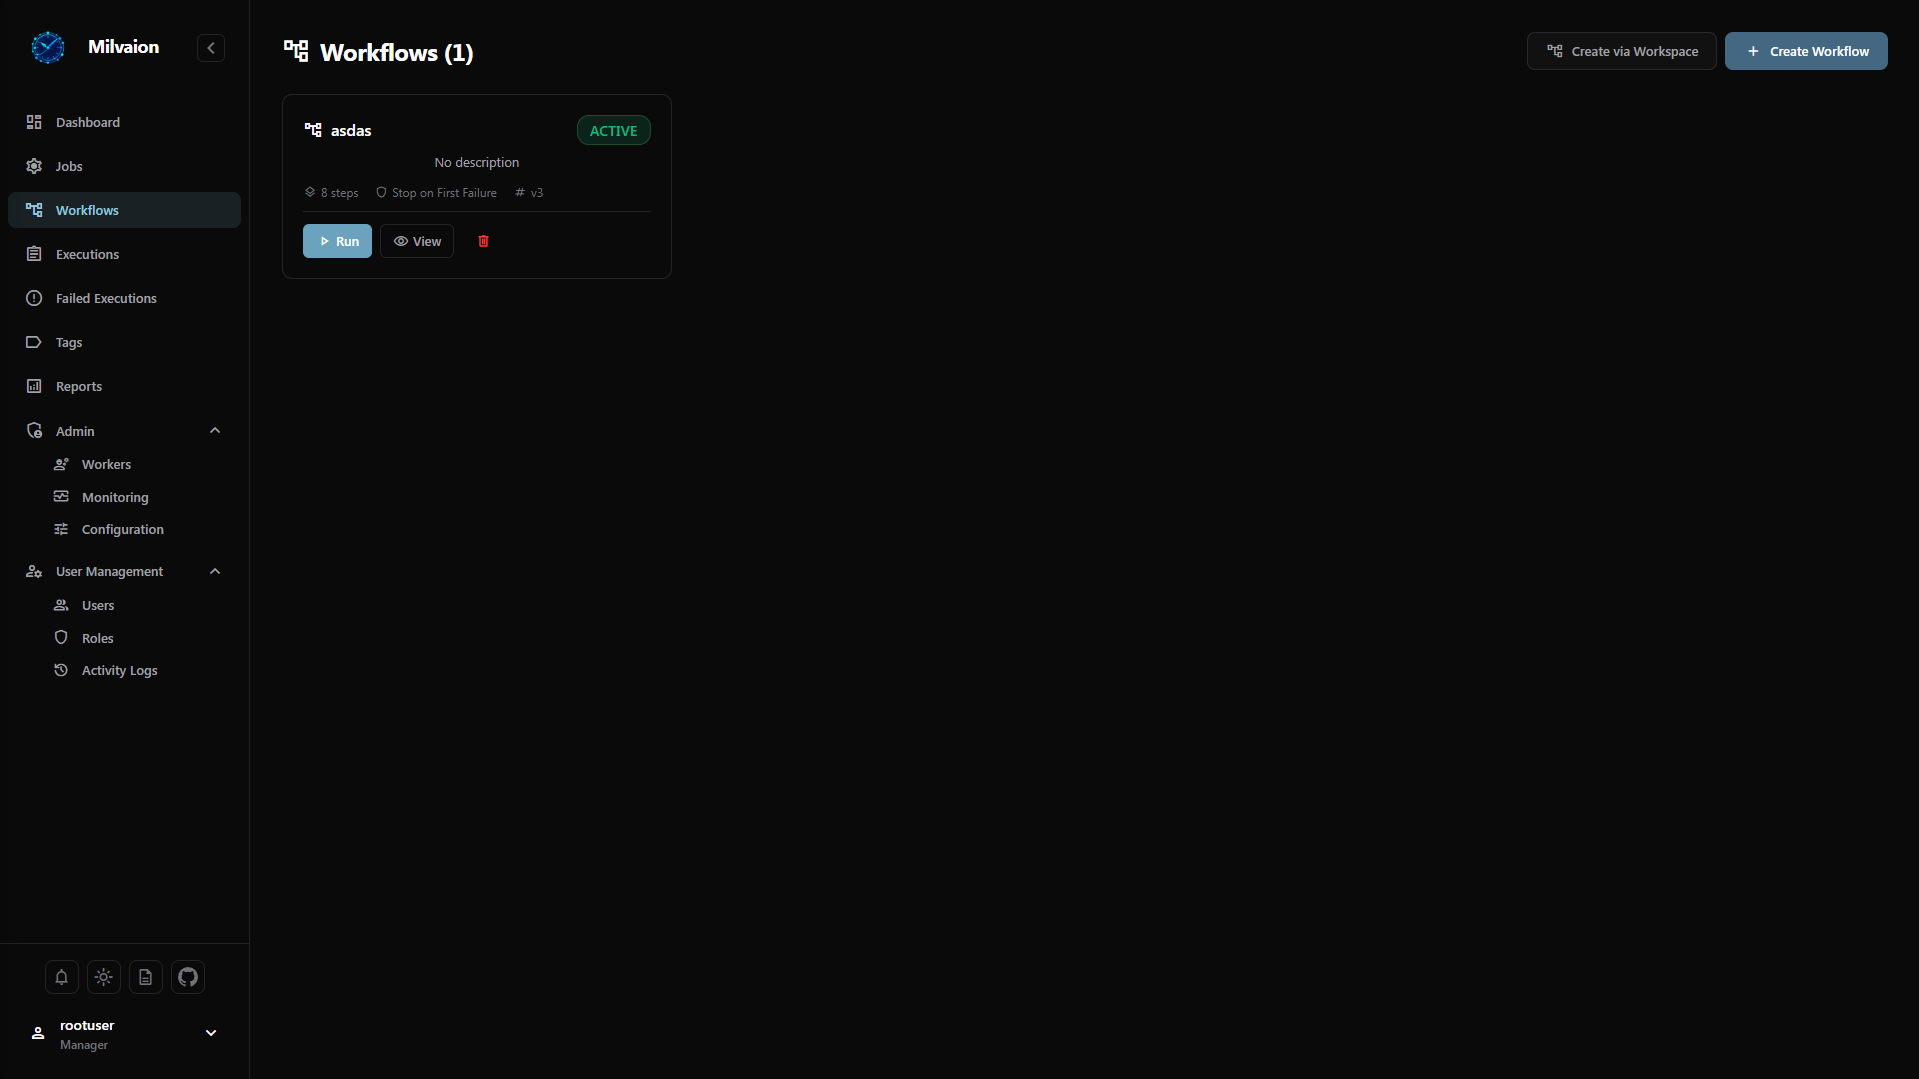
Workflows
Workflow List
Browse all defined workflows and their current states.
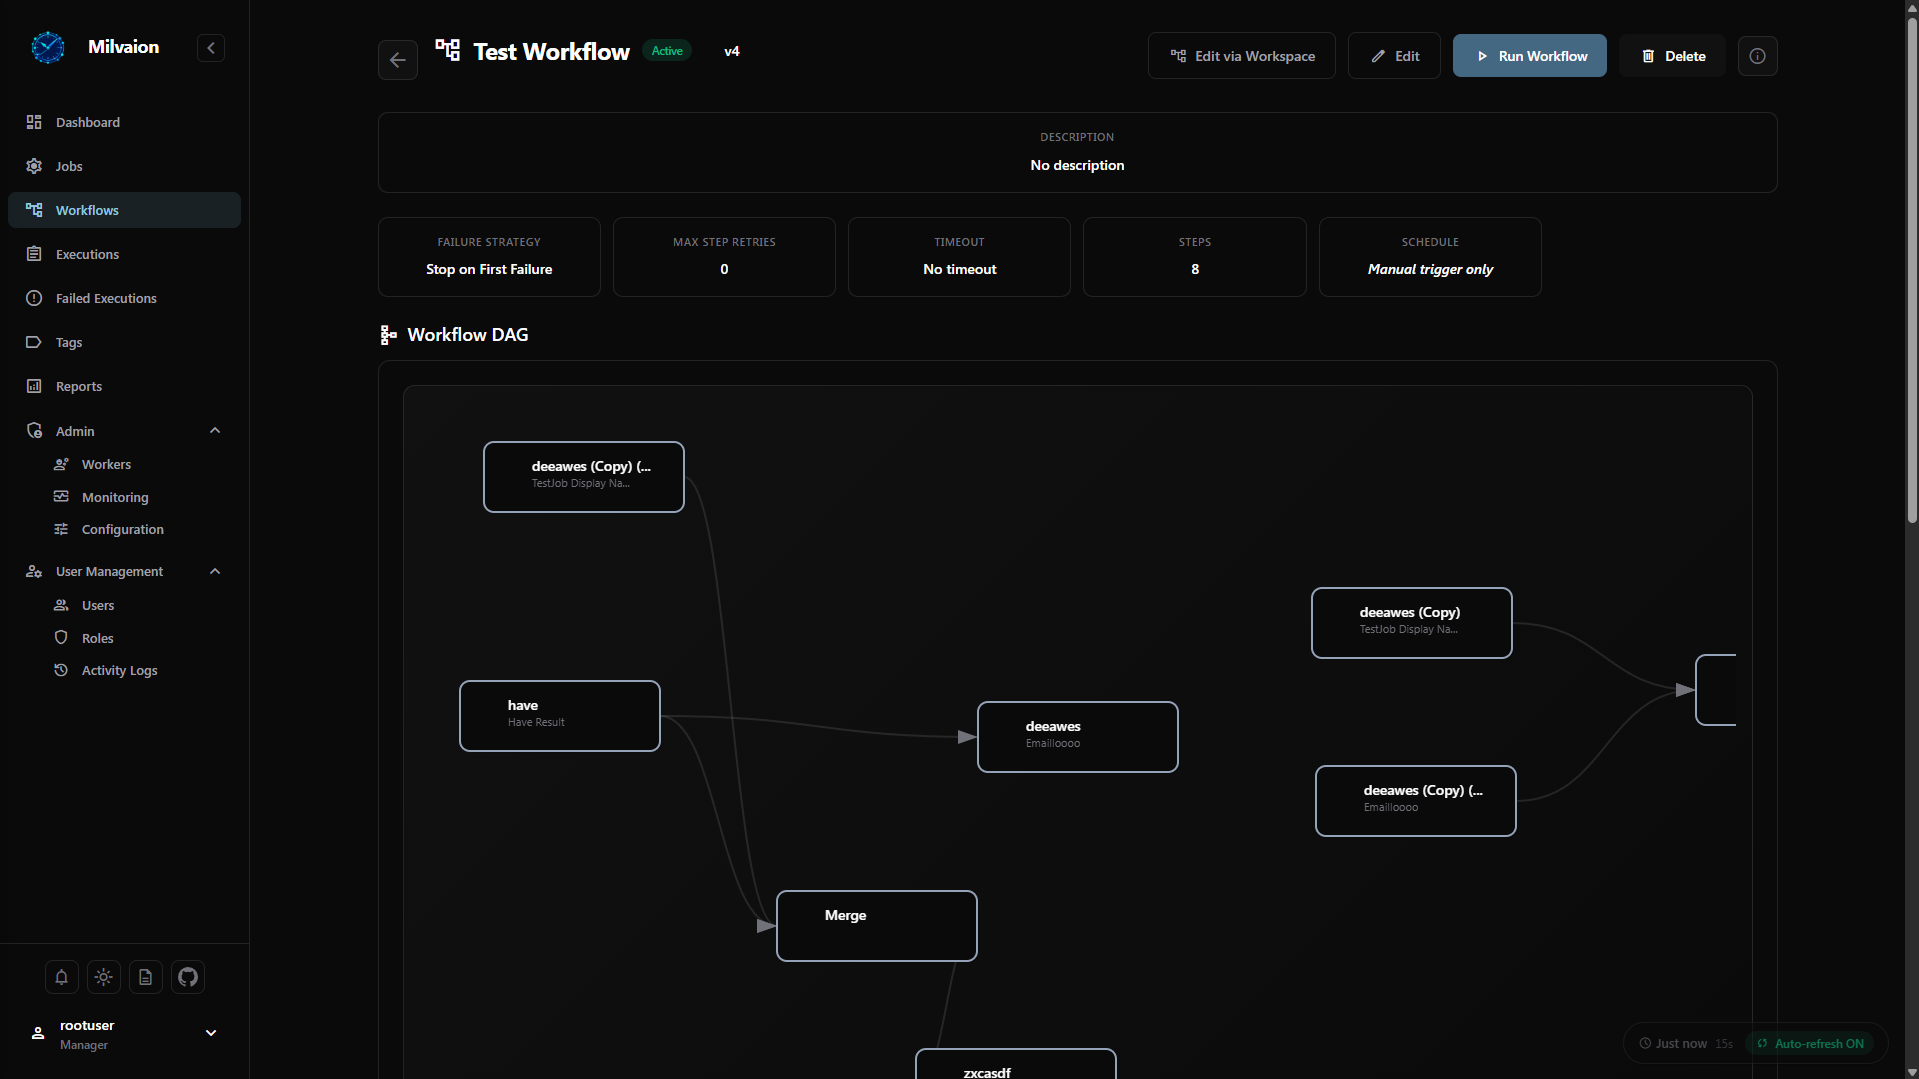
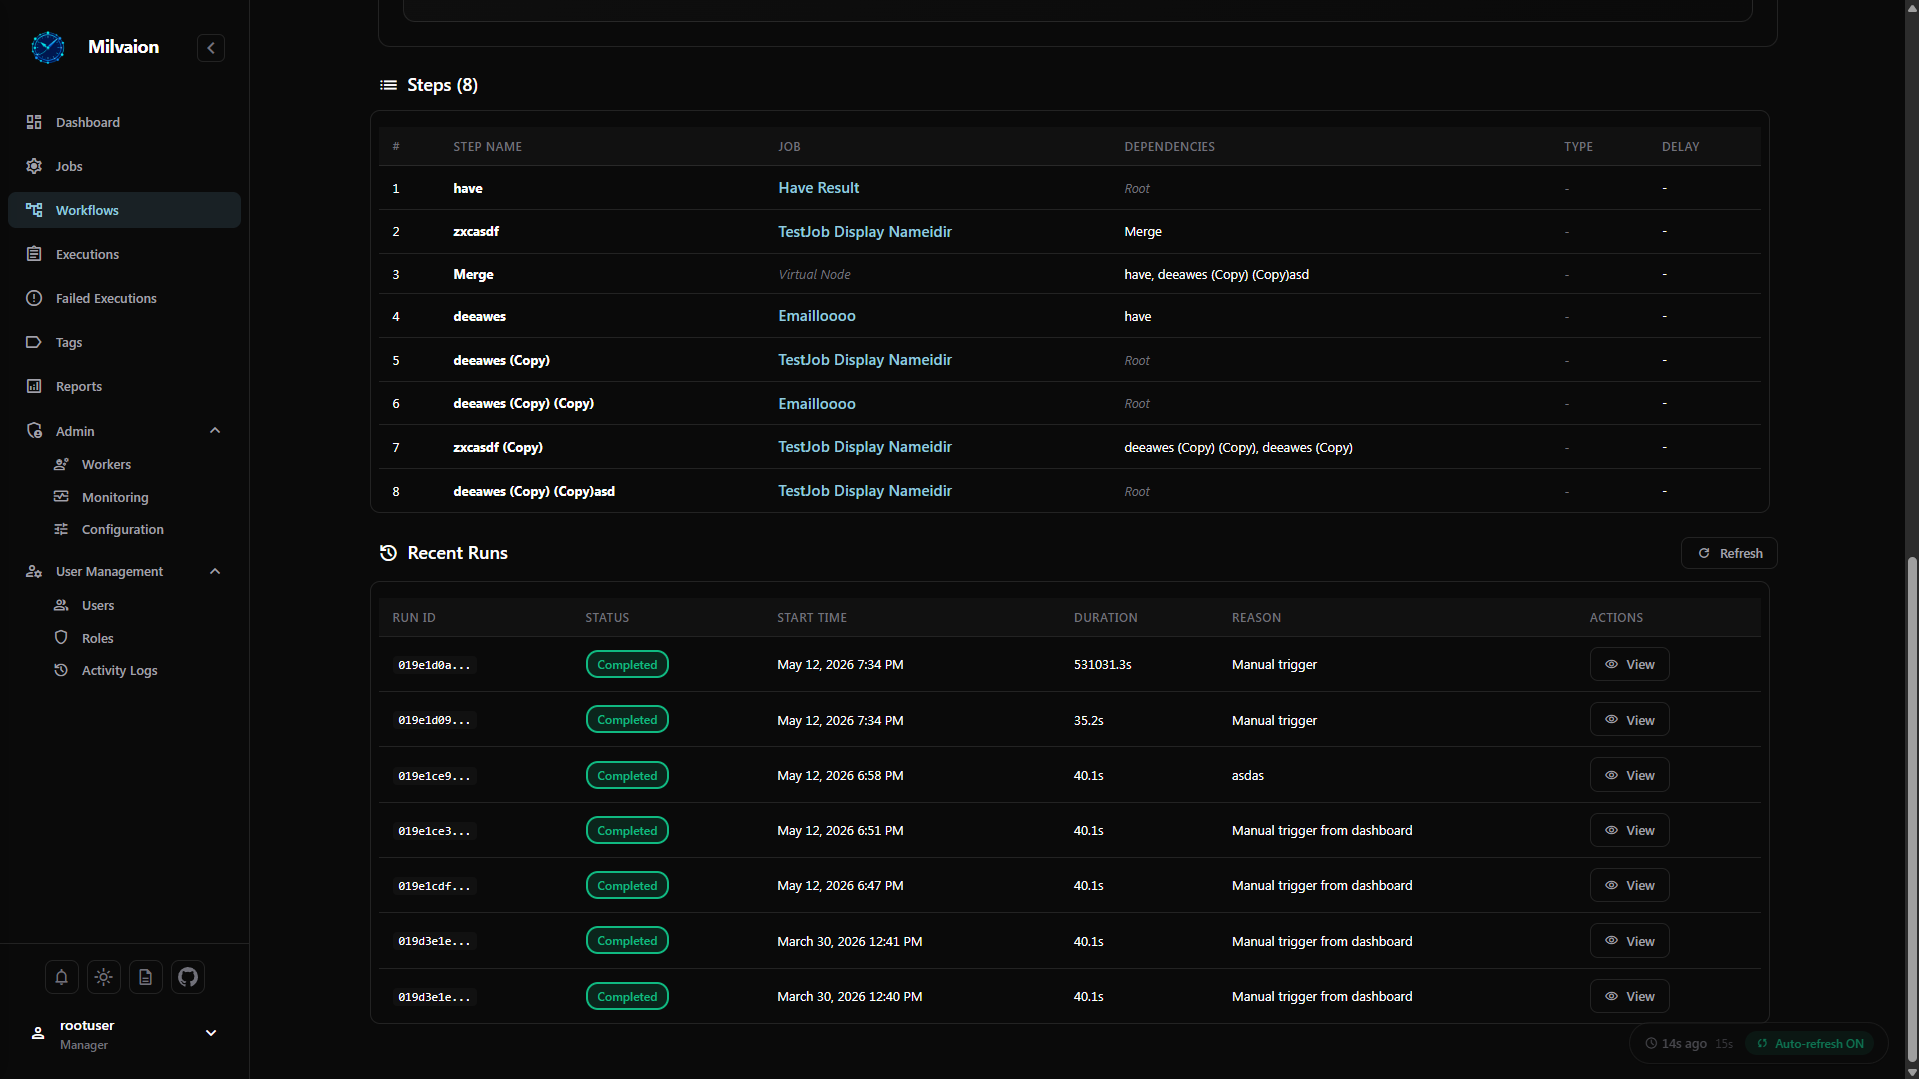
Workflow Details
View step-by-step details and execution history of a specific workflow.
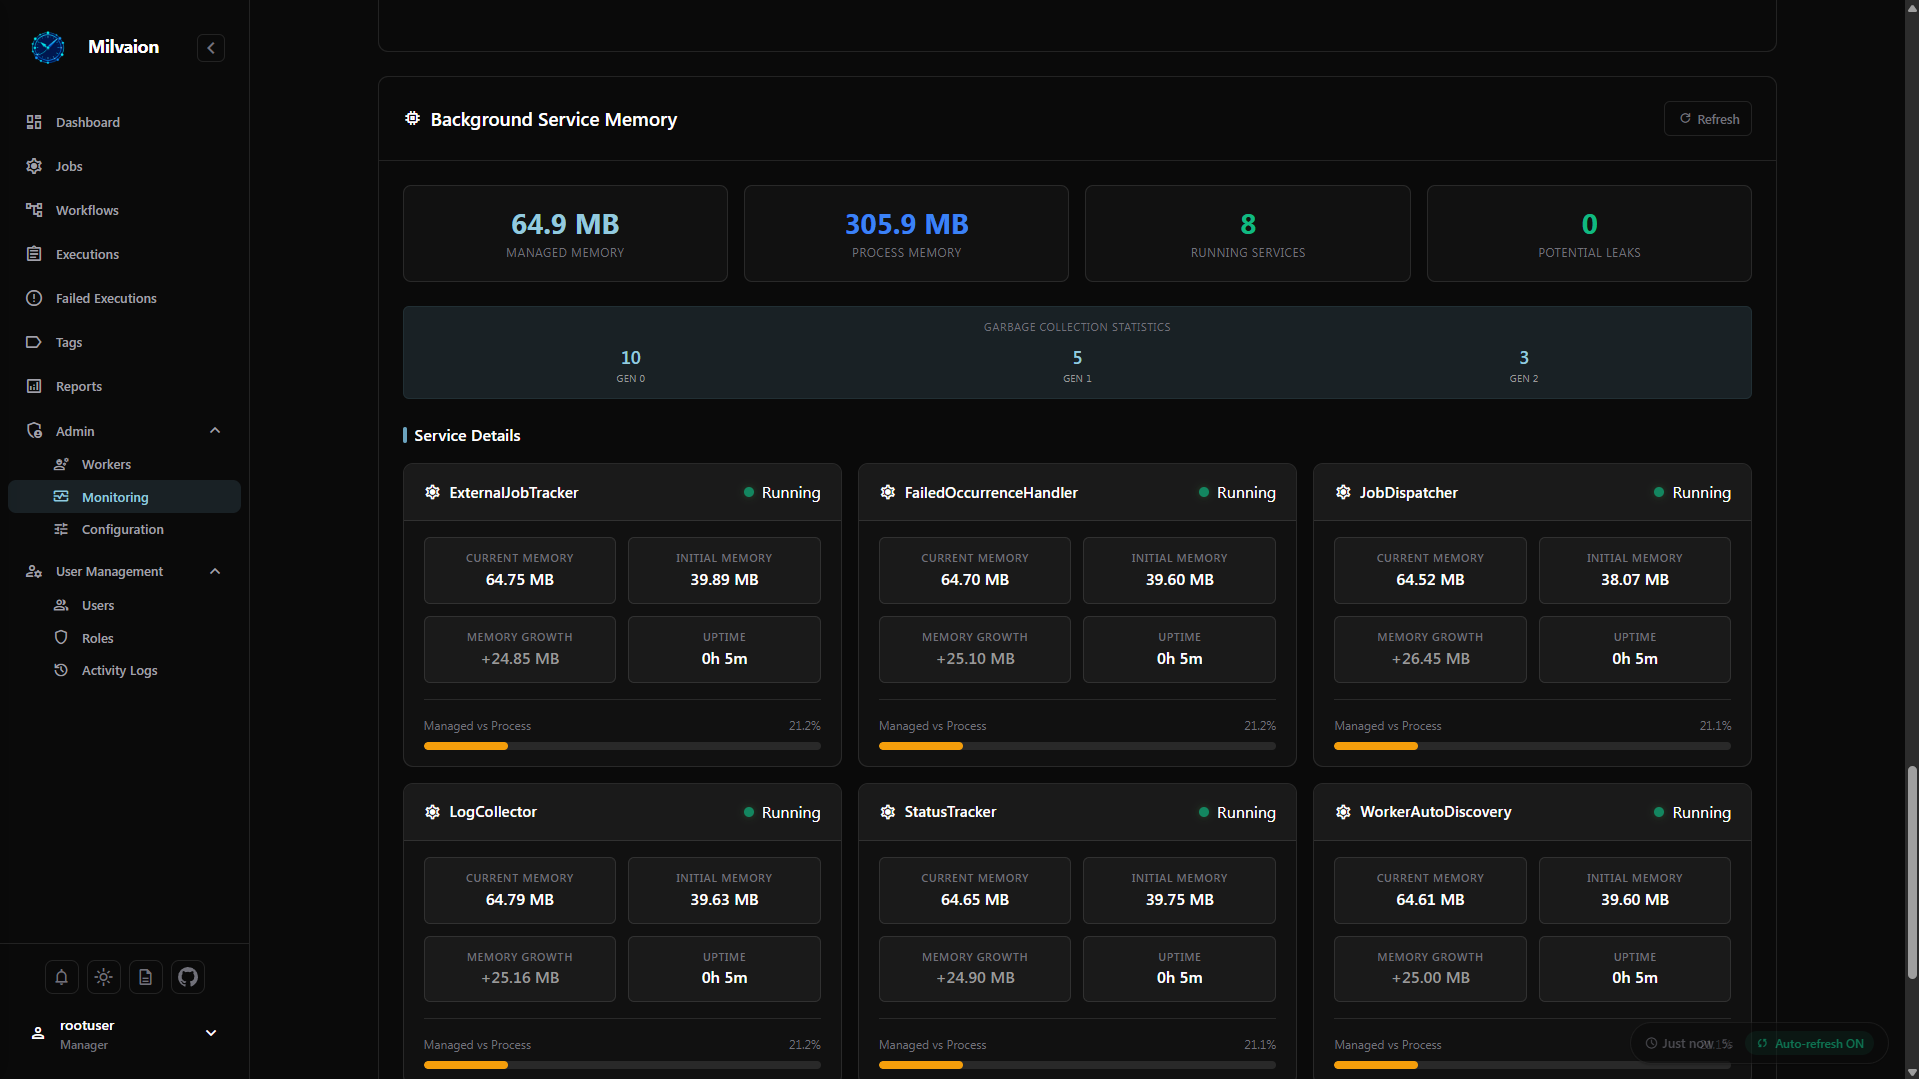
Settings
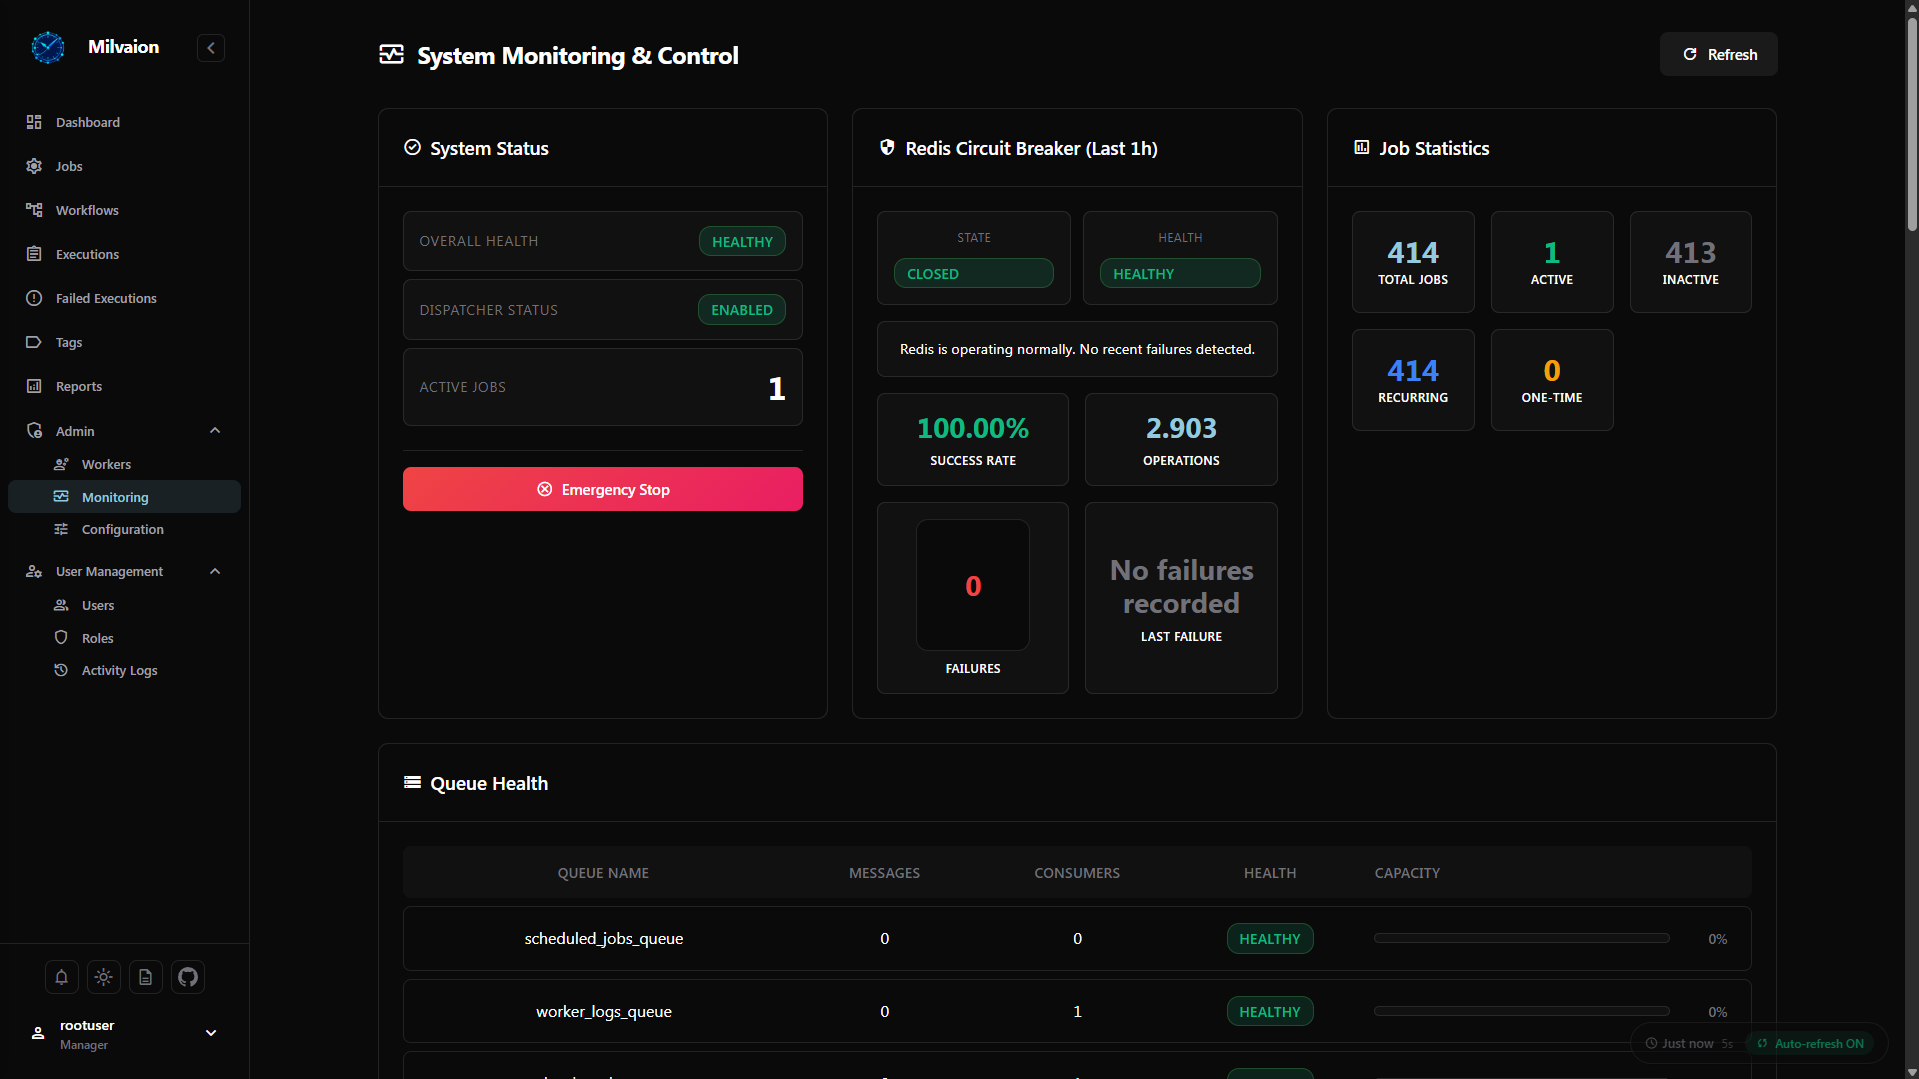
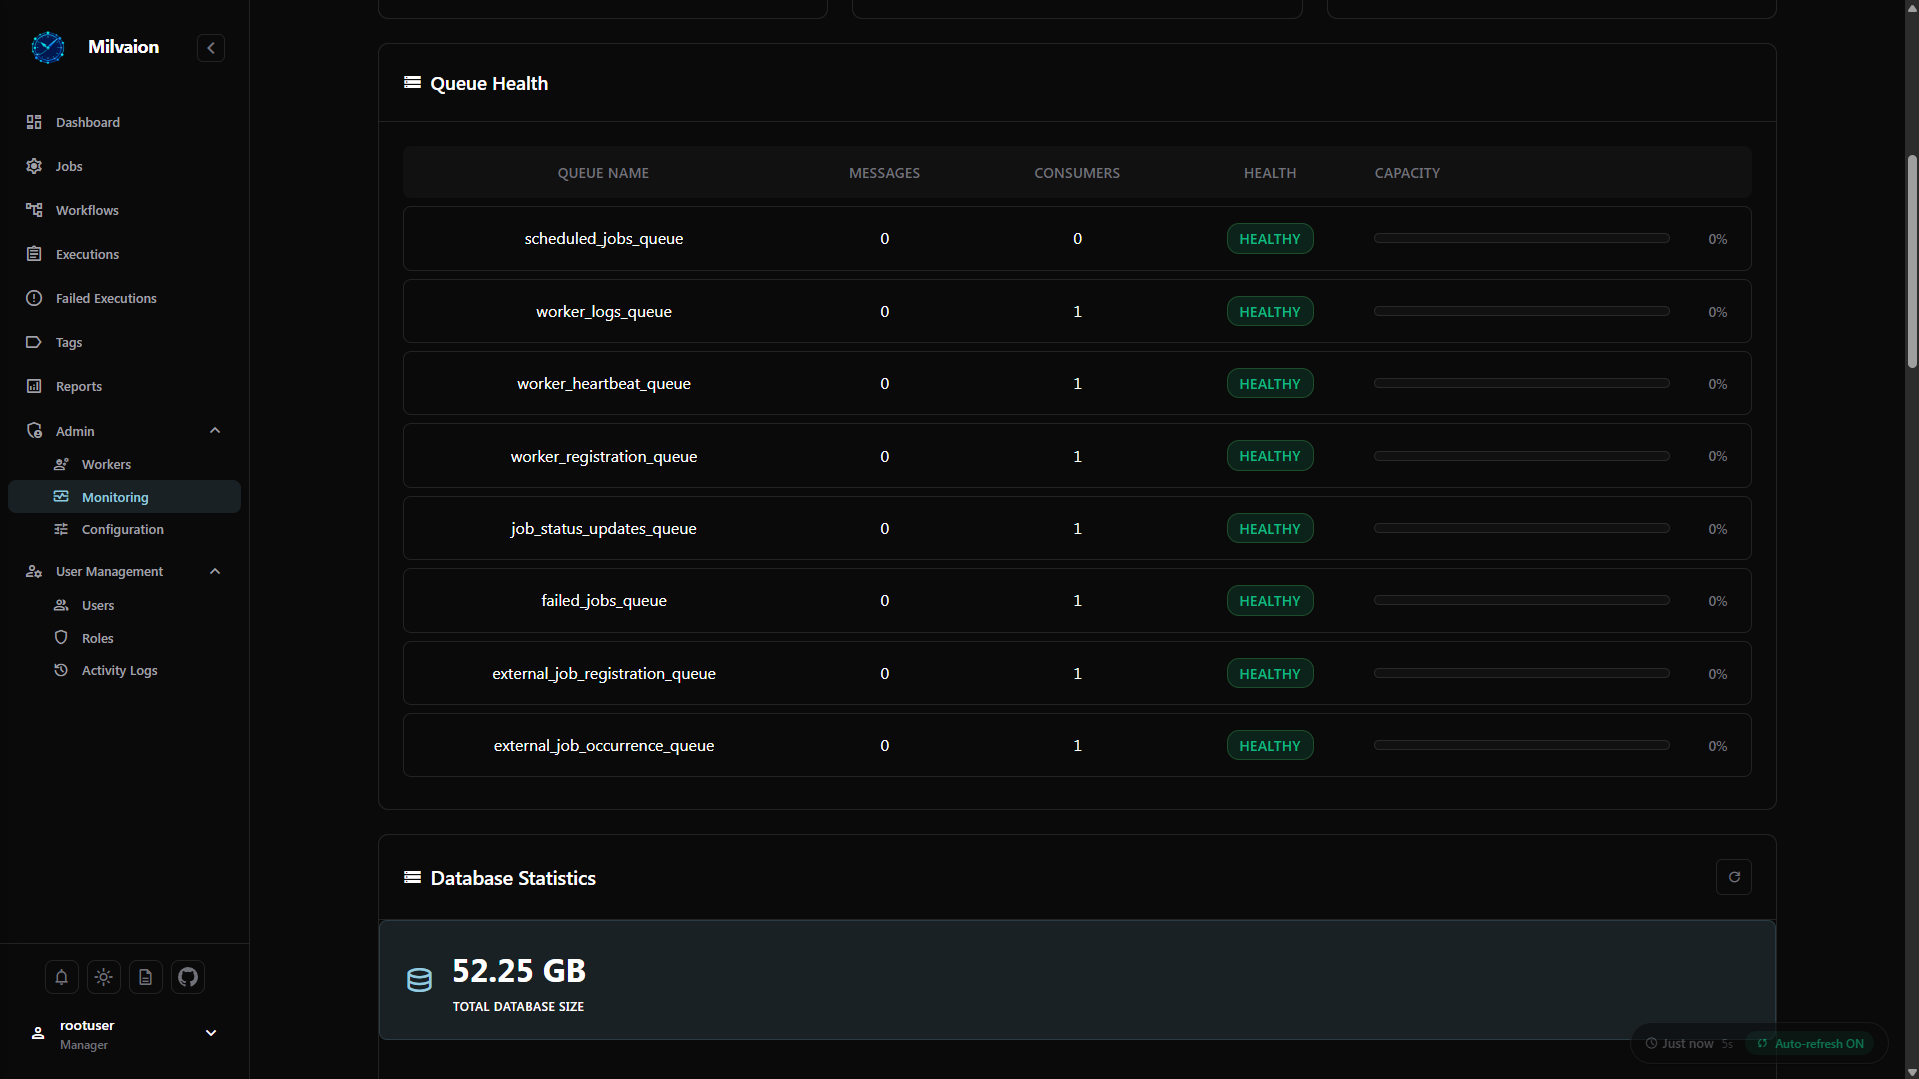
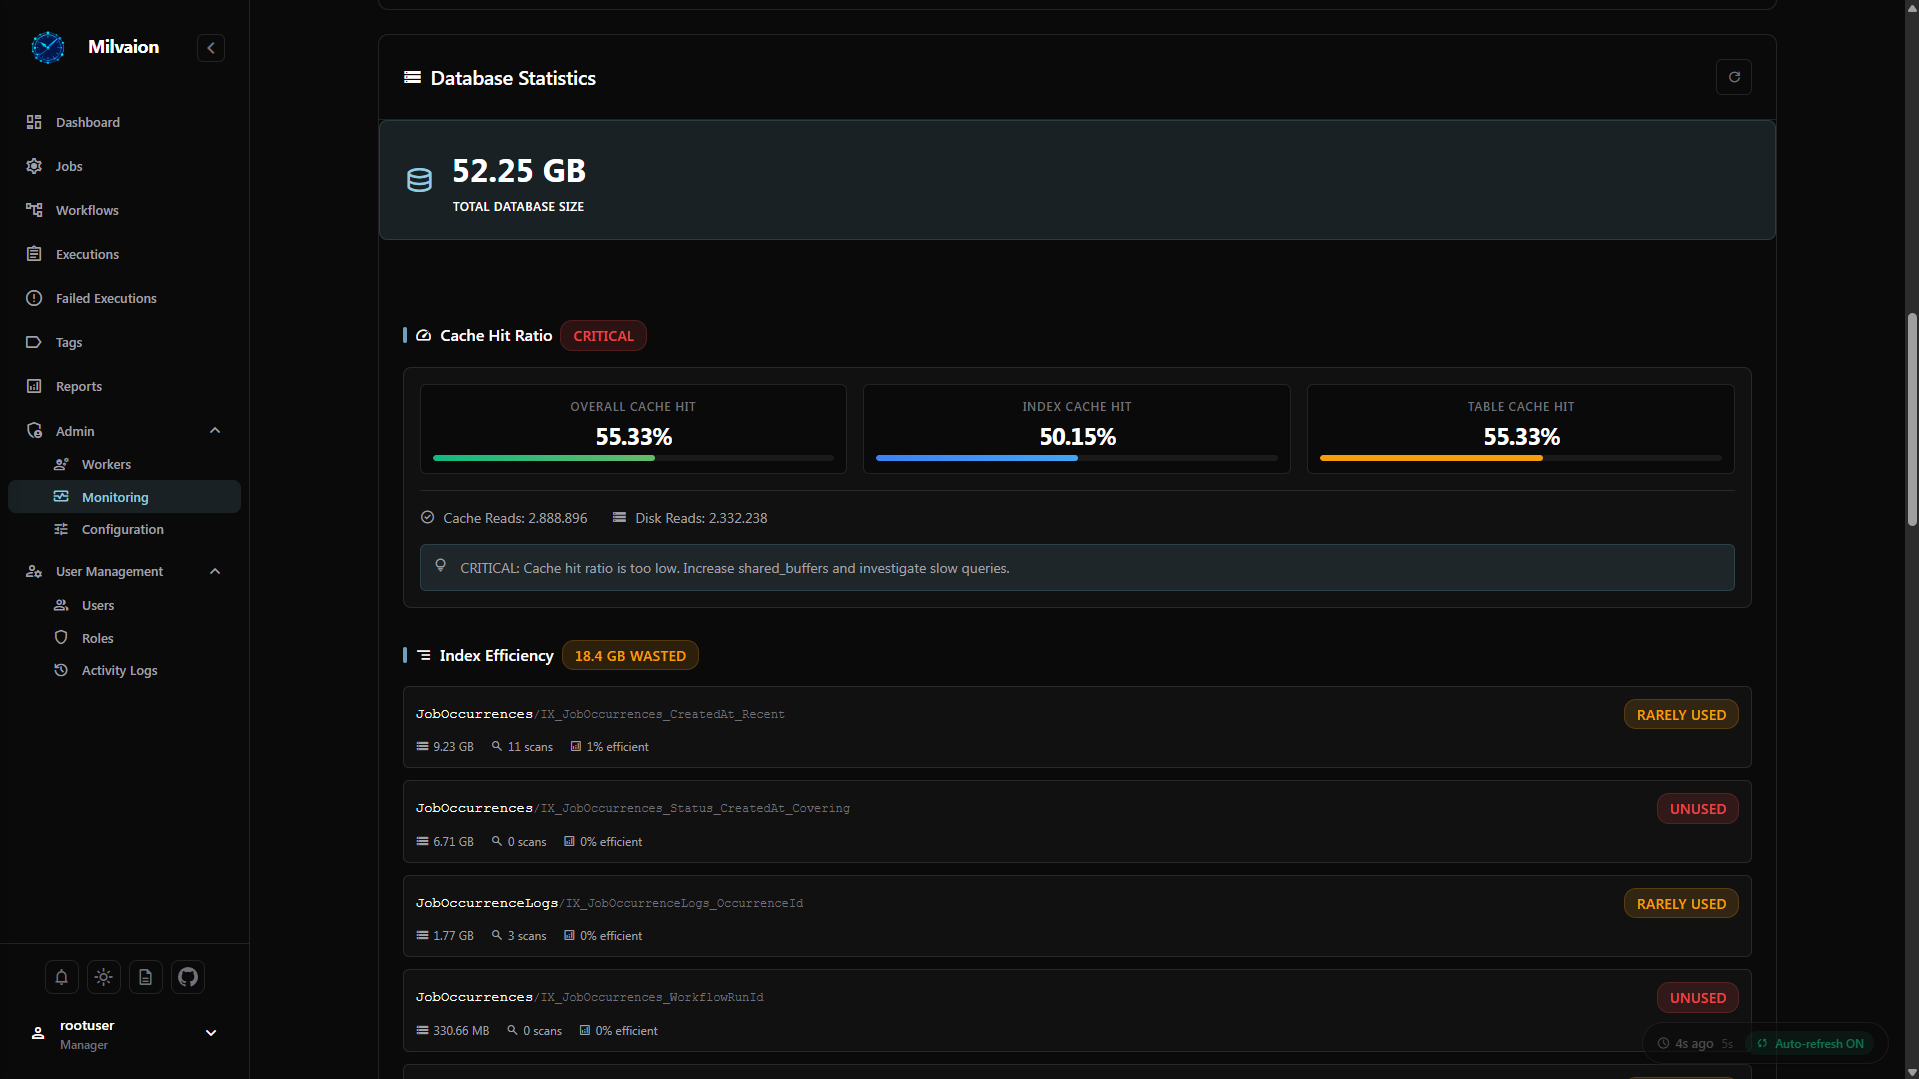
System Monitoring
View and manage system settings.
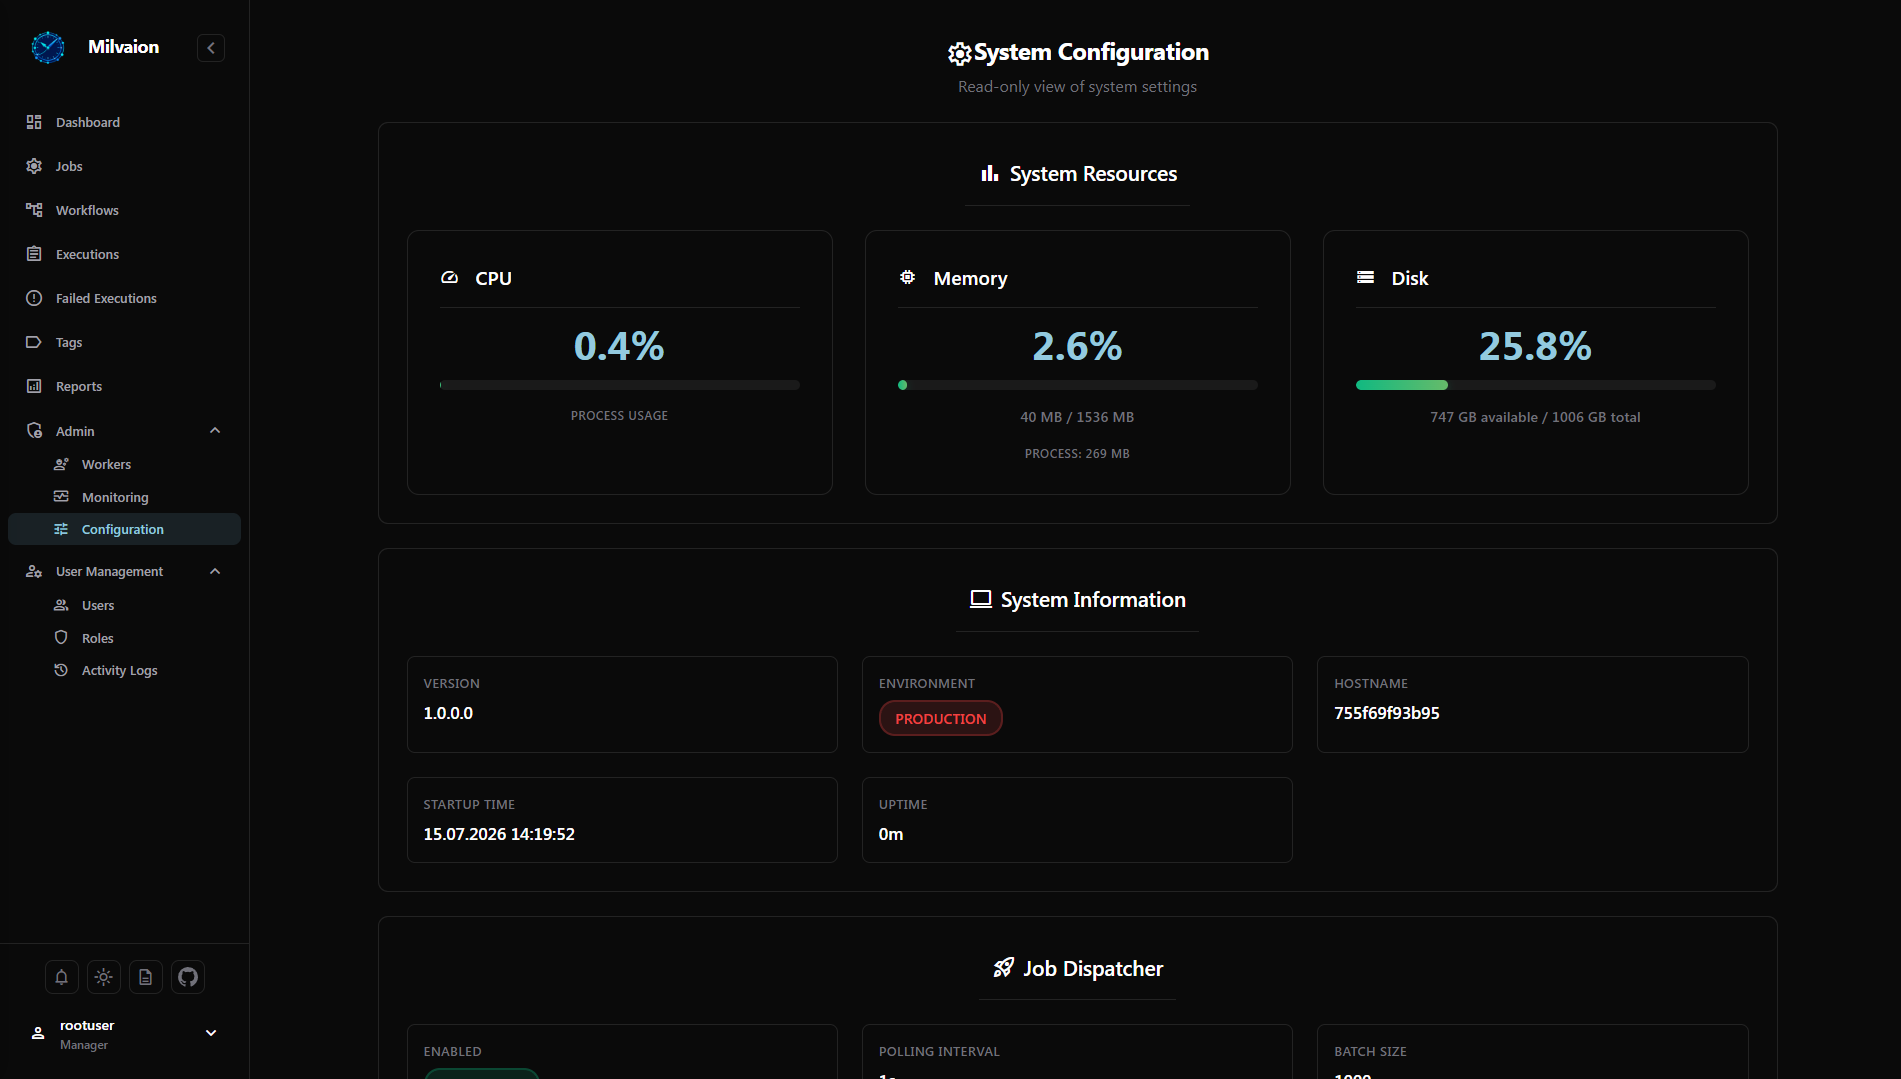
System Configuration
View and manage system settings.
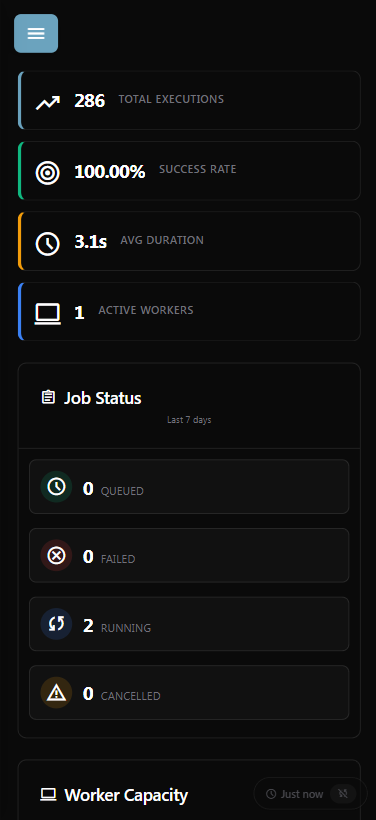
Mobile Responsive
The dashboard is fully responsive and works on mobile devices.