Monitoring & Observability
This guide covers monitoring Milvaion in production, including health checks, metrics, logging, and alerting.
Health Checks
API Health Endpoints
| Endpoint | Purpose | Use For |
|---|---|---|
/health/live | Is the process running? | Kubernetes liveness probe |
/health/ready | Are dependencies healthy? | Kubernetes readiness probe |
/health | Full health with details | Debugging, dashboards |
Liveness Check
curl http://localhost:5000/api/v1/healthcheck/live
Response:
{
  "status": "Healthy",
  "timestamp": "2026-01-14T17:55:12.5466734Z",
  "uptime": "16.05:34:46.9359664"
}
Readiness Check
curl http://localhost:5000/api/v1/healthcheck/ready
Response:
{
  "status": "Healthy",
  "duration": "00:00:00.0015505",
  "timestamp": "2026-01-14T17:55:39.7914455Z",
  "checks": [
    {
      "name": "PostgreSQL",
      "status": "Healthy",
      "description": "PostgreSQL database connection is healthy",
      "duration": "00:00:00.0014398",
      "tags": [
        "database",
        "sql"
      ],
      "data": {
        "DatabaseName": "MilvaionDb",
        "ConnectionStatus": "Connected",
        "ProviderName": "Npgsql.EntityFrameworkCore.PostgreSQL"
      }
    },
    {
      "name": "Redis",
      "status": "Healthy",
      "description": "Redis connection is healthy",
      "duration": "00:00:00.0004801",
      "tags": [
        "redis",
        "cache"
      ],
      "data": {
        "ConnectionStatus": "Connected",
        "Database": "0"
      }
    },
    {
      "name": "RabbitMQ",
      "status": "Healthy",
      "description": "RabbitMQ connection is healthy",
      "duration": "00:00:00.0000037",
      "tags": [
        "rabbitmq",
        "messaging"
      ],
      "data": {
        "ConnectionStatus": "Connected",
        "Host": "rabbitmq",
        "Port": "5672",
        "IsOpen": "True"
      }
    }
  ]
}
Kubernetes Probes
spec:
  containers:
    - name: api
      livenessProbe:
        httpGet:
          path: /api/v1/healthcheck/live
          port: 8080
        initialDelaySeconds: 30
        periodSeconds: 10
        failureThreshold: 3
      readinessProbe:
        httpGet:
          path: /api/v1/healthcheck/ready
          port: 8080
        initialDelaySeconds: 10
        periodSeconds: 5
        failureThreshold: 3
Worker Health
Workers support two health check approaches: file-based (for Console Workers) and HTTP endpoint-based (for API Workers).
Configuration
Enable health checks in appsettings.json:
{
  "Worker": {
    "HealthCheck": {
      "Enabled": true,
      "LiveFilePath": "/tmp/live", // Only for file health check. (for console workers)
      "ReadyFilePath": "/tmp/ready", // Only for file health check. (for console workers)
      "IntervalSeconds": 30
    }
  }
}
| Setting | Default | Description |
|---|---|---|
Enabled | false | Enable/disable health checks |
LiveFilePath | /tmp/live | File path for liveness probe |
ReadyFilePath | /tmp/ready | File path for readiness probe |
IntervalSeconds | 30 | Health check interval |
Option 1: Console Worker (File-Based)
For workers without HTTP endpoints, use AddFileHealthCheck():
using Microsoft.Extensions.Hosting;
using Milvasoft.Milvaion.Sdk.Worker;

var builder = Host.CreateApplicationBuilder(args);

// Register Worker SDK
builder.Services.AddMilvaionWorkerWithJobs(builder.Configuration);

// Add file-based health checks (Redis + RabbitMQ)
builder.Services.AddFileHealthCheck(builder.Configuration);

var host = builder.Build();
await host.RunAsync();
Kubernetes probes:
spec:
  containers:
    - name: worker
      livenessProbe:
        exec:
          command: ["test", "-f", "/tmp/live"]
        initialDelaySeconds: 30
        periodSeconds: 30
        failureThreshold: 3
      readinessProbe:
        exec:
          command: ["test", "-f", "/tmp/ready"]
        initialDelaySeconds: 10
        periodSeconds: 10
        failureThreshold: 3
Docker Compose healthcheck:
worker:
  healthcheck:
    test: ["CMD", "test", "-f", "/tmp/live"]
    interval: 30s
    timeout: 5s
    retries: 3
    start_period: 30s
Option 2: API Worker (HTTP Endpoints)
For workers with HTTP endpoints, use AddHealthCheckEndpoints() and UseHealthCheckEndpoints():
using Milvasoft.Milvaion.Sdk.Worker;
using Milvasoft.Milvaion.Sdk.Worker.HealthChecks;

var builder = WebApplication.CreateBuilder(args);

// Add health checks (Redis + RabbitMQ)
builder.Services.AddHealthChecks()
                .AddCheck<RedisHealthCheck>("Redis", tags: ["redis", "cache"])
                .AddCheck<RabbitMQHealthCheck>("RabbitMQ", tags: ["rabbitmq", "messaging"]);

// Register Worker SDK
builder.Services.AddMilvaionWorkerWithJobs(builder.Configuration);

// Register health check endpoint services
builder.Services.AddHealthCheckEndpoints(builder.Configuration);

var app = builder.Build();

// Map health check endpoints
app.UseHealthCheckEndpoints(builder.Configuration);

await app.RunAsync();
Available endpoints:
| Endpoint | Purpose | Response |
|---|---|---|
/health | Simple check | "Ok" |
/health/live | Liveness probe | { status, timestamp, uptime } |
/health/ready | Readiness probe | { status, duration, checks[] } |
/health/startup | Startup probe | { status, timestamp, uptime } |
Kubernetes probes:
spec:
  containers:
    - name: api-worker
      livenessProbe:
        httpGet:
          path: /health/live
          port: 8080
        initialDelaySeconds: 30
        periodSeconds: 10
        failureThreshold: 3
      readinessProbe:
        httpGet:
          path: /health/ready
          port: 8080
        initialDelaySeconds: 10
        periodSeconds: 5
        failureThreshold: 3
      startupProbe:
        httpGet:
          path: /health/startup
          port: 8080
        initialDelaySeconds: 5
        periodSeconds: 5
        failureThreshold: 30
Health Check Behavior
The SDK includes built-in health checks for:
| Check | What it Verifies |
|---|---|
| Redis | Connection status via PING command |
| RabbitMQ | Connection status via IConnectionMonitor |
File-based health check logic:
- Live file exists: Worker process is running and not completely unhealthy
- Ready file exists: All health checks (Redis, RabbitMQ) are healthy
- Files are deleted on graceful shutdown
- Files are updated every
IntervalSeconds
Dashboard Metrics
Built-in Statistics
Access via Dashboard home or API:
curl http://localhost:5000/api/v1/dashboard
{
  "isSuccess": true,
  "statusCode": 200,
  "messages": [
    {
      "key": "",
      "message": "Operation successful!",
      "type": 1
    }
  ],
  "data": {
    "totalExecutions": 3546,
    "queuedJobs": 0,
    "completedJobs": 3513,
    "failedOccurrences": 32,
    "cancelledJobs": 1,
    "timedOutJobs": 0,
    "runningJobs": 0,
    "averageDuration": 2509.362653003131,
    "successRate": 99.06937394247038,
    "totalWorkers": 1,
    "totalWorkerInstances": 1,
    "workerCurrentJobs": 0,
    "workerMaxCapacity": 128,
    "workerUtilization": 0,
    "executionsPerMinute": 10,
    "executionsPerSecond": 0, // It means lower than 1
    "peakExecutionsPerMinute": 10
  },
  "metadatas": []
}
Worker Status
curl http://localhost:5000/api/v1/workers
[
  {
  "isSuccess": true,
  "statusCode": 200,
  "messages": [],
  "data": [
    {
      "workerId": "sample-worker",
      "displayName": "sample-worker (sample-worker-172a5243)",
      "routingPatterns": {
        "AlwaysFailingJob": "alwaysfailing.*",
        "LongRunningTestJob": "longrunningtest.*",
        "NonParallelJob": "nonparallel.*",
        "SendEmailJob": "sendemail.*",
        "TestJob": "test.*"
      },
      "jobNames": [
        "AlwaysFailingJob",
        "LongRunningTestJob",
        "NonParallelJob",
        "SendEmailJob",
        "TestJob"
      ],
      "currentJobs": 0,
      "status": "Active",
      "lastHeartbeat": "2026-01-14T18:04:52.0539333+00:00",
      "registeredAt": "2026-01-14T18:01:27.1426831+00:00",
      "version": "1.0.0.0",
      "metadata": "{\"ProcessorCount\":16,\"OSVersion\":\"Unix 6.6.87.1\",\"RuntimeVersion\":\"10.0.1\",\"JobConfigs\":[{\"JobType\":\"AlwaysFailingJob\",\"ConsumerId\":\"alwaysfailing-consumer\",\"MaxParallelJobs\":8,\"ExecutionTimeoutSeconds\":30},{\"JobType\":\"LongRunningTestJob\",\"ConsumerId\":\"longrunning-consumer\",\"MaxParallelJobs\":8,\"ExecutionTimeoutSeconds\":10},{\"JobType\":\"NonParallelJob\",\"ConsumerId\":\"nonparallel-consumer\",\"MaxParallelJobs\":1,\"ExecutionTimeoutSeconds\":30},{\"JobType\":\"SendEmailJob\",\"ConsumerId\":\"email-consumer\",\"MaxParallelJobs\":16,\"ExecutionTimeoutSeconds\":600},{\"JobType\":\"TestJob\",\"ConsumerId\":\"test-consumer\",\"MaxParallelJobs\":32,\"ExecutionTimeoutSeconds\":120}]}",
      "instances": [
        {
          "instanceId": "sample-worker-172a5243",
          "hostName": "1fc7768572fd",
          "ipAddress": "172.18.0.6",
          "currentJobs": 0,
          "status": 0,
          "lastHeartbeat": "2026-01-14T18:04:52.0539333+00:00",
          "registeredAt": "2026-01-14T18:01:27.1454977+00:00"
        }
      ]
    }
  ],
  "metadatas": []
}
]
Logging
Milvaion uses Serilog for structured logging. By default, logs are written to the console. You can optionally enable Seq integration for centralized log management.
Default Behavior
- Console output: All logs are written to console by default
- Structured format: Logs include contextual properties for filtering
- Automatic enrichment: Each log entry includes
AppNameandEnvironmentproperties - Path filtering: Health check and metrics endpoints are excluded from logs
Seq Integration (Optional)
To send logs to Seq, enable it in appsettings.json:
{
  "MilvaionConfig": {
    "Logging": {
      "Seq": {
        "Enabled": true,
        "Uri": "http://seq:5341"
      }
    }
  }
}
| Setting | Default | Description |
|---|---|---|
Enabled | false | Enable/disable Seq logging |
Uri | - | Seq server URL |
Log Level Configuration
Configure log levels via the standard Serilog configuration:
{
  "Serilog": {
    "MinimumLevel": {
      "Default": "Information",
      "Override": {
        "Microsoft.AspNetCore": "Information",
        "System": "Warning",
        "Microsoft.AspNetCore.Mvc": "Warning",
        "Microsoft.AspNetCore.Cors": "Warning",
        "Microsoft.AspNetCore.Routing": "Warning",
        "Microsoft.AspNetCore.Hosting.Diagnostics": "Warning",
        "Microsoft.EntityFrameworkCore.Database.Command": "Warning",
        "Microsoft.EntityFrameworkCore.Update": "Warning",
        "Microsoft.AspNetCore.Authentication.JwtBearer.JwtBearerHandler": "Warning"
      }
    }
  }
}
| Level | Use For |
|---|---|
Verbose | Detailed debugging (very noisy) |
Debug | Development diagnostics |
Information | General operational events |
Warning | Unexpected but handled events |
Error | Failures requiring attention |
Fatal | Critical failures |
Log Enrichment
All log entries are automatically enriched with:
| Property | Description |
|---|---|
AppName | Application identifier (milvaion-api) |
Environment | Current deployment environment (MILVA_ENV environment variable) |
Log Correlation
Use CorrelationId to trace a job across services. In Seq:
CorrelationId = "corr-789"
OpenTelemetry Integration
Milvaion includes built-in OpenTelemetry support for metrics and distributed tracing. Metrics are exposed via a Prometheus-compatible HTTP endpoint.
Configuration
Enable and configure OpenTelemetry in appsettings.json:
{
  "MilvaionConfig": {
    "OpenTelemetry": {
      "Enabled": true,
      "ExportPath": "/api/metrics",
      "Service": "milvaion-api",
      "Environment": "production",
      "Job": "api",
      "Instance": "milvaion-prod-01"
    }
  }
}
| Setting | Default | Description |
|---|---|---|
Enabled | false | Enable/disable OpenTelemetry observability |
ExportPath | /api/metrics | Prometheus scraping endpoint path |
Service | milvaion-api | Service name for resource identification |
Environment | MILVA_ENV env var | Environment label (e.g., production, staging) |
Job | api | Job label for Prometheus |
Instance | Machine name | Instance identifier for multi-instance deployments |
Accessing Metrics
Prometheus metrics are exposed at the configured ExportPath:
curl http://localhost:5000/api/metrics
This endpoint returns metrics in Prometheus text format, ready for scraping.
Collected Metrics
The following metric sources are automatically instrumented:
| Source | Description |
|---|---|
| ASP.NET Core | HTTP request duration, status codes, active requests |
| HTTP Client | Outbound HTTP request metrics |
| Process | CPU, memory, GC, thread pool metrics |
| Npgsql (PostgreSQL) | Database query metrics |
| Entity Framework Core | ORM-level database metrics |
| System.Net.Http | HTTP client diagnostics |
| System.Net.NameResolution | DNS resolution metrics |
| System.Threading | Thread pool and synchronization metrics |
| System.Runtime | .NET runtime metrics |
Background Service Metrics
Milvaion exposes custom metrics for all background services via the Milvaion.BackgroundServices meter:
Job Dispatcher:
| Metric | Type | Description |
|---|---|---|
milvaion_dispatcher_jobs_dispatched | Counter | Total jobs dispatched to workers |
milvaion_dispatcher_dispatch_failures | Counter | Total dispatch failures |
milvaion_dispatcher_dispatch_duration | Histogram | Duration of dispatch operations (ms) |
milvaion_dispatcher_pending_jobs | Gauge | Jobs pending dispatch |
Status Tracker:
| Metric | Type | Description |
|---|---|---|
milvaion_status_tracker_updates_processed | Counter | Total status updates processed |
milvaion_status_tracker_update_failures | Counter | Total status update failures |
milvaion_status_tracker_batch_duration | Histogram | Batch processing duration (ms) |
milvaion_status_tracker_updates_by_status | Counter | Updates by final status (labels: status) |
milvaion_status_tracker_batch_size | Gauge | Current batch size |
Log Collector:
| Metric | Type | Description |
|---|---|---|
milvaion_log_collector_logs_collected | Counter | Total worker logs collected |
milvaion_log_collector_collection_failures | Counter | Total collection failures |
milvaion_log_collector_batch_duration | Histogram | Log batch processing duration (ms) |
milvaion_log_collector_batch_size | Gauge | Current log batch size |
Worker Discovery:
| Metric | Type | Description |
|---|---|---|
milvaion_worker_discovery_registrations | Counter | Total worker registrations |
milvaion_worker_discovery_heartbeats | Counter | Total heartbeats received |
milvaion_worker_discovery_heartbeat_failures | Counter | Heartbeat processing failures |
milvaion_worker_discovery_heartbeat_duration | Histogram | Heartbeat batch processing duration (ms) |
milvaion_worker_discovery_active_workers | Gauge | Currently active workers |
Zombie Detector:
| Metric | Type | Description |
|---|---|---|
milvaion_zombie_detector_detected | Counter | Zombie occurrences detected |
milvaion_zombie_detector_recovered | Counter | Zombie occurrences recovered |
milvaion_zombie_detector_detection_duration | Histogram | Detection scan duration (ms) |
Failed Occurrence Handler:
| Metric | Type | Description |
|---|---|---|
milvaion_failed_handler_processed | Counter | Failed occurrences processed |
milvaion_failed_handler_retried | Counter | Failed occurrences retried |
milvaion_failed_handler_process_duration | Histogram | Processing duration (ms) |
General Service Metrics:
| Metric | Type | Description |
|---|---|---|
milvaion_background_service_iterations | Counter | Service loop iterations (labels: service) |
milvaion_background_service_errors | Counter | Service errors (labels: service, error_type) |
milvaion_background_service_iteration_duration | Histogram | Iteration duration (labels: service) |
Distributed Tracing
Tracing is automatically configured for:
- ASP.NET Core requests (with exception recording)
- HTTP client calls
- PostgreSQL queries (via Npgsql)
- Entity Framework Core operations
- Milvaion internal activity sources
Trace data includes resource attributes for correlation:
| Attribute | Description |
|---|---|
service | Service name |
environment | Deployment environment |
job | Job identifier |
instance | Instance identifier |
Prometheus Scrape Configuration
Add Milvaion to your Prometheus configuration:
scrape_configs:
  - job_name: 'milvaion-api'
    scrape_interval: 15s
    static_configs:
      - targets: ['milvaion-api:5000']
    metrics_path: '/api/metrics'
Alerting
Critical Alerts
| Condition | Severity | Action |
|---|---|---|
| API health check failing | Critical | Page on-call |
| All workers offline | Critical | Page on-call |
| DLQ depth > 100 | High | Investigate failures |
| Success rate < 95% | High | Check failing jobs |
| Queue depth growing | Medium | Scale workers |
| Zombie jobs detected | Medium | Check worker health |
Prometheus Alert Rules
groups:
  - name: milvaion
    rules:
      - alert: MilvaionApiDown
        expr: up{job="milvaion-api"} == 0
        for: 1m
        labels:
          severity: critical
        annotations:
          summary: "Milvaion API is down"

      - alert: MilvaionNoActiveWorkers
        expr: count(milvaion_worker_active) == 0
        for: 2m
        labels:
          severity: critical
        annotations:
          summary: "No active Milvaion workers"

      - alert: MilvaionHighFailureRate
        expr: |
          rate(milvaion_jobs_failed[5m]) /
          rate(milvaion_jobs_completed[5m]) > 0.1
        for: 5m
        labels:
          severity: high
        annotations:
          summary: "Job failure rate > 10%"

      - alert: MilvaionDLQGrowing
        expr: milvaion_dlq_depth > 50
        for: 10m
        labels:
          severity: high
        annotations:
          summary: "Dead letter queue has {{ $value }} messages"
Grafana Dashboards
Milvaion includes two pre-configured Grafana dashboards located in build/grafana/provisioning/dashboards/json/:
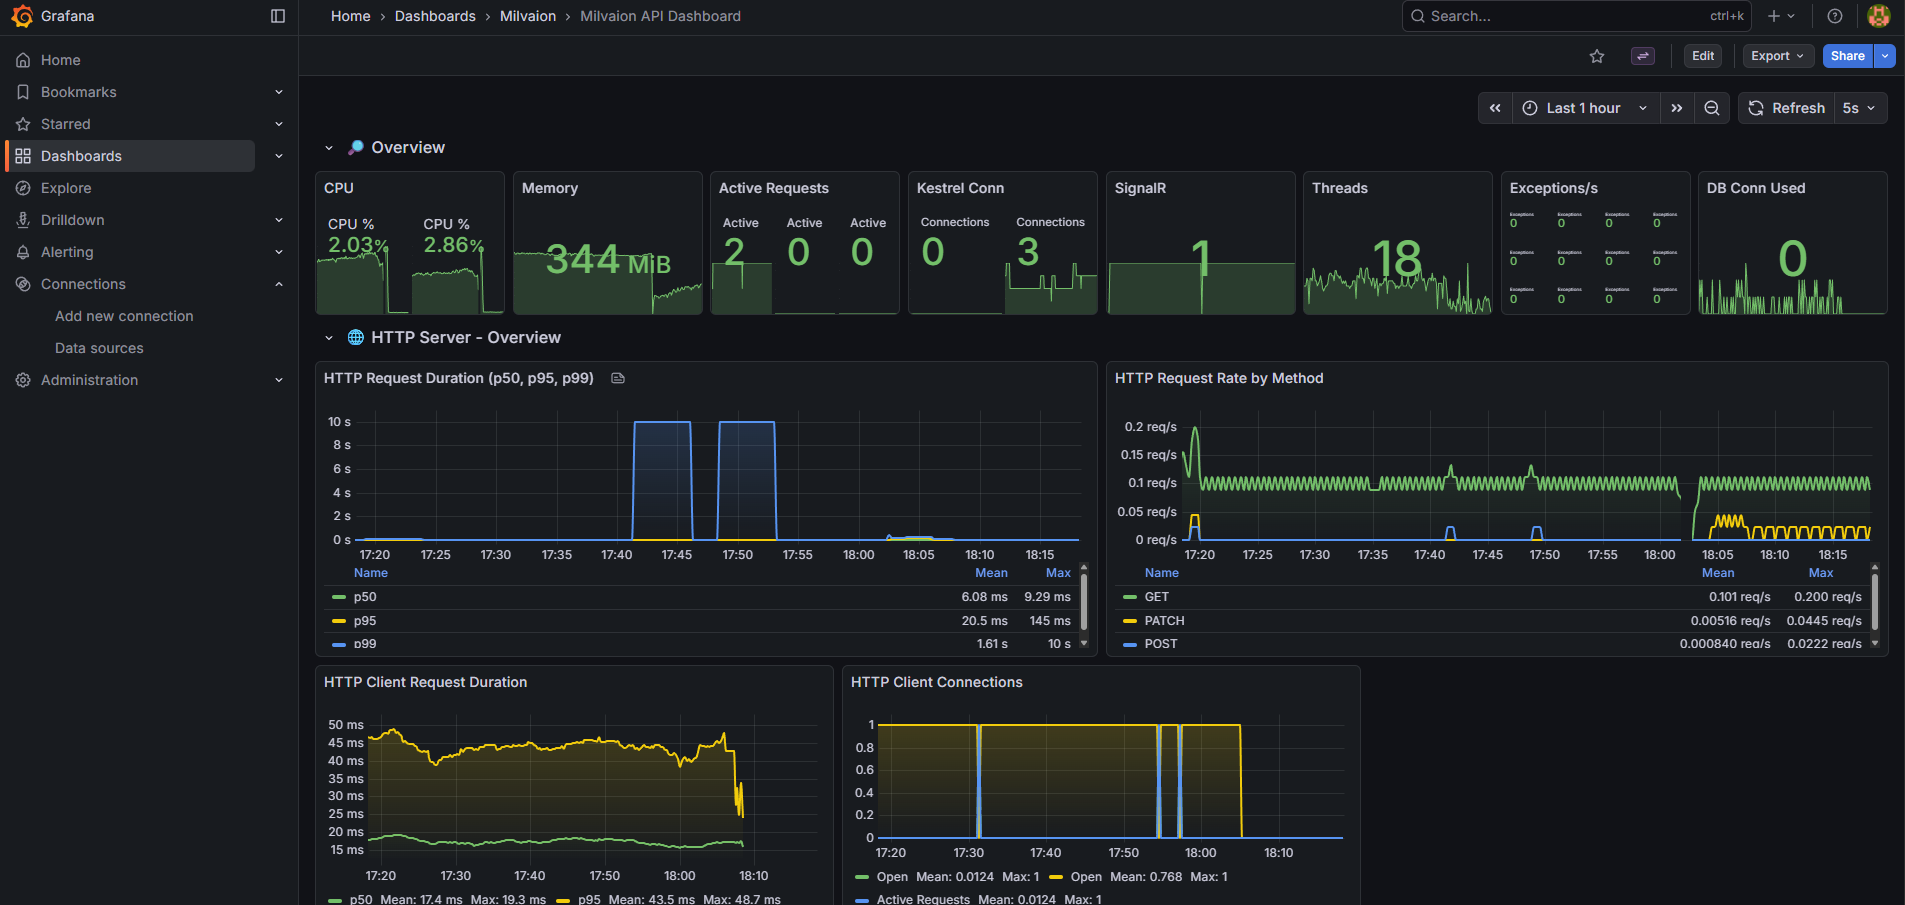
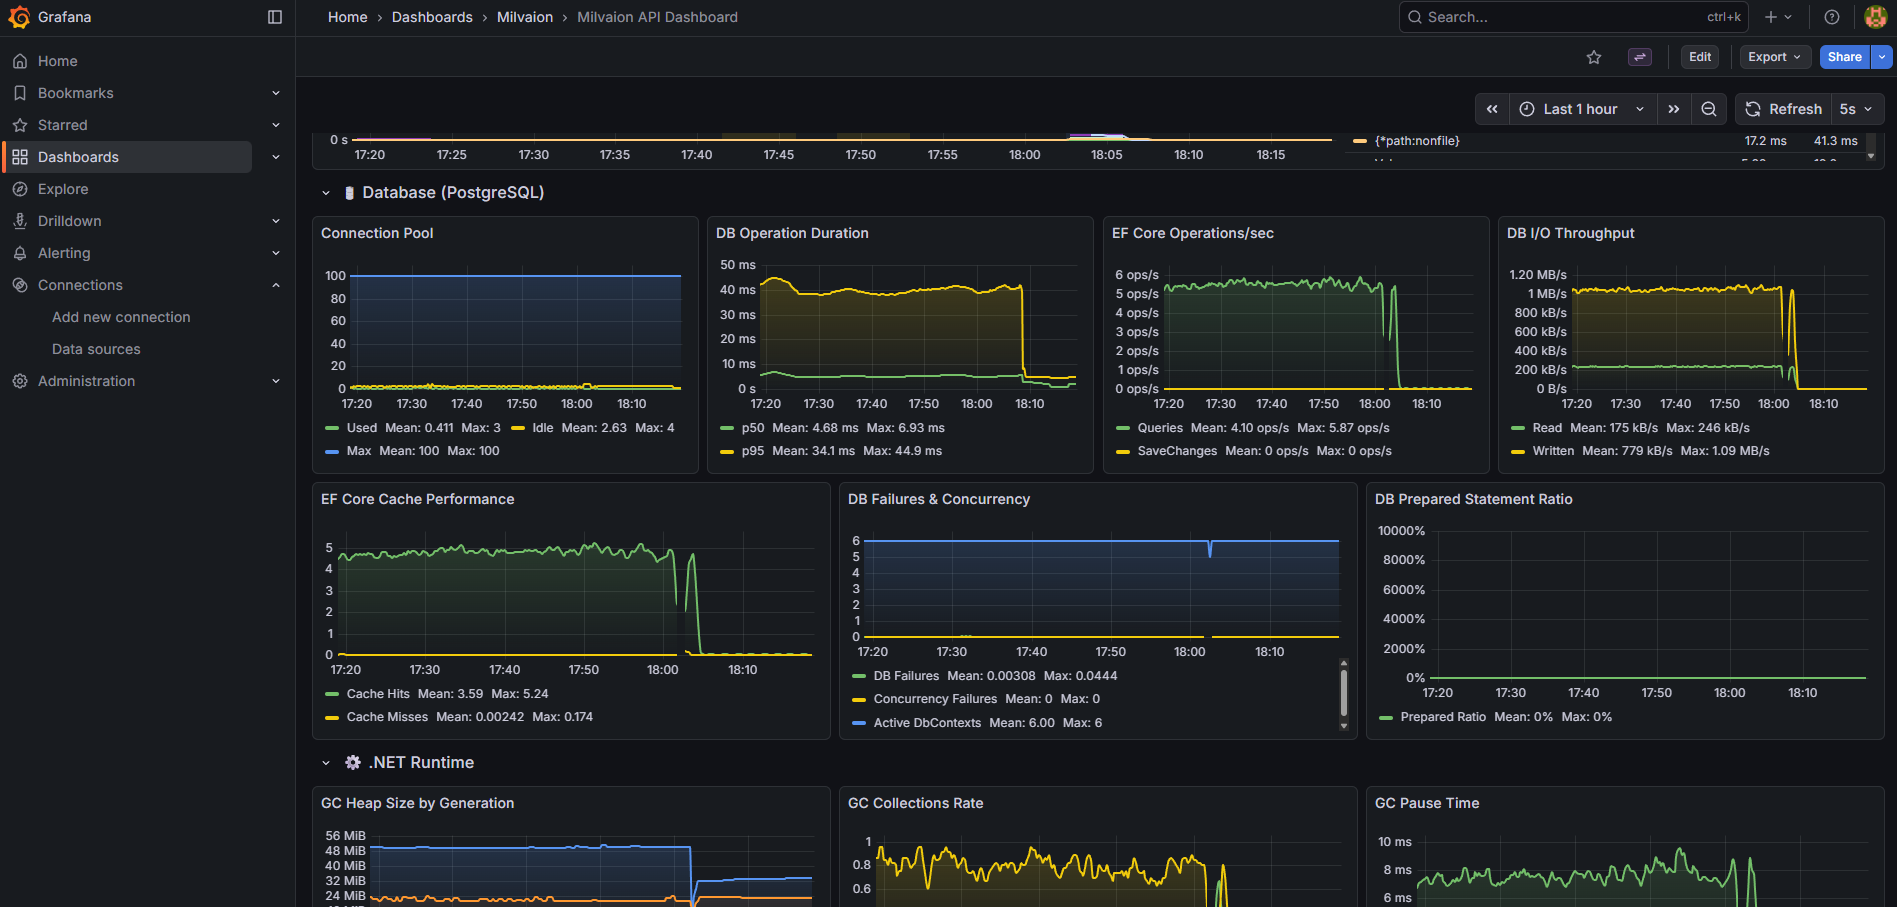
1. Milvaion API Dashboard (milvaion-api.json)
General API and infrastructure monitoring:
| Section | Panels |
|---|---|
| Overview | CPU, Memory, Active Requests, Kestrel Connections, SignalR, Thread Pool |
| HTTP Requests | Request Rate, Response Times (p50/p95/p99), Status Codes, Error Rate |
| Database | Query Duration, Active Connections, Commands/sec, Connection Pool |
| Memory | GC Collections, Heap Size, LOH Size, Allocation Rate |
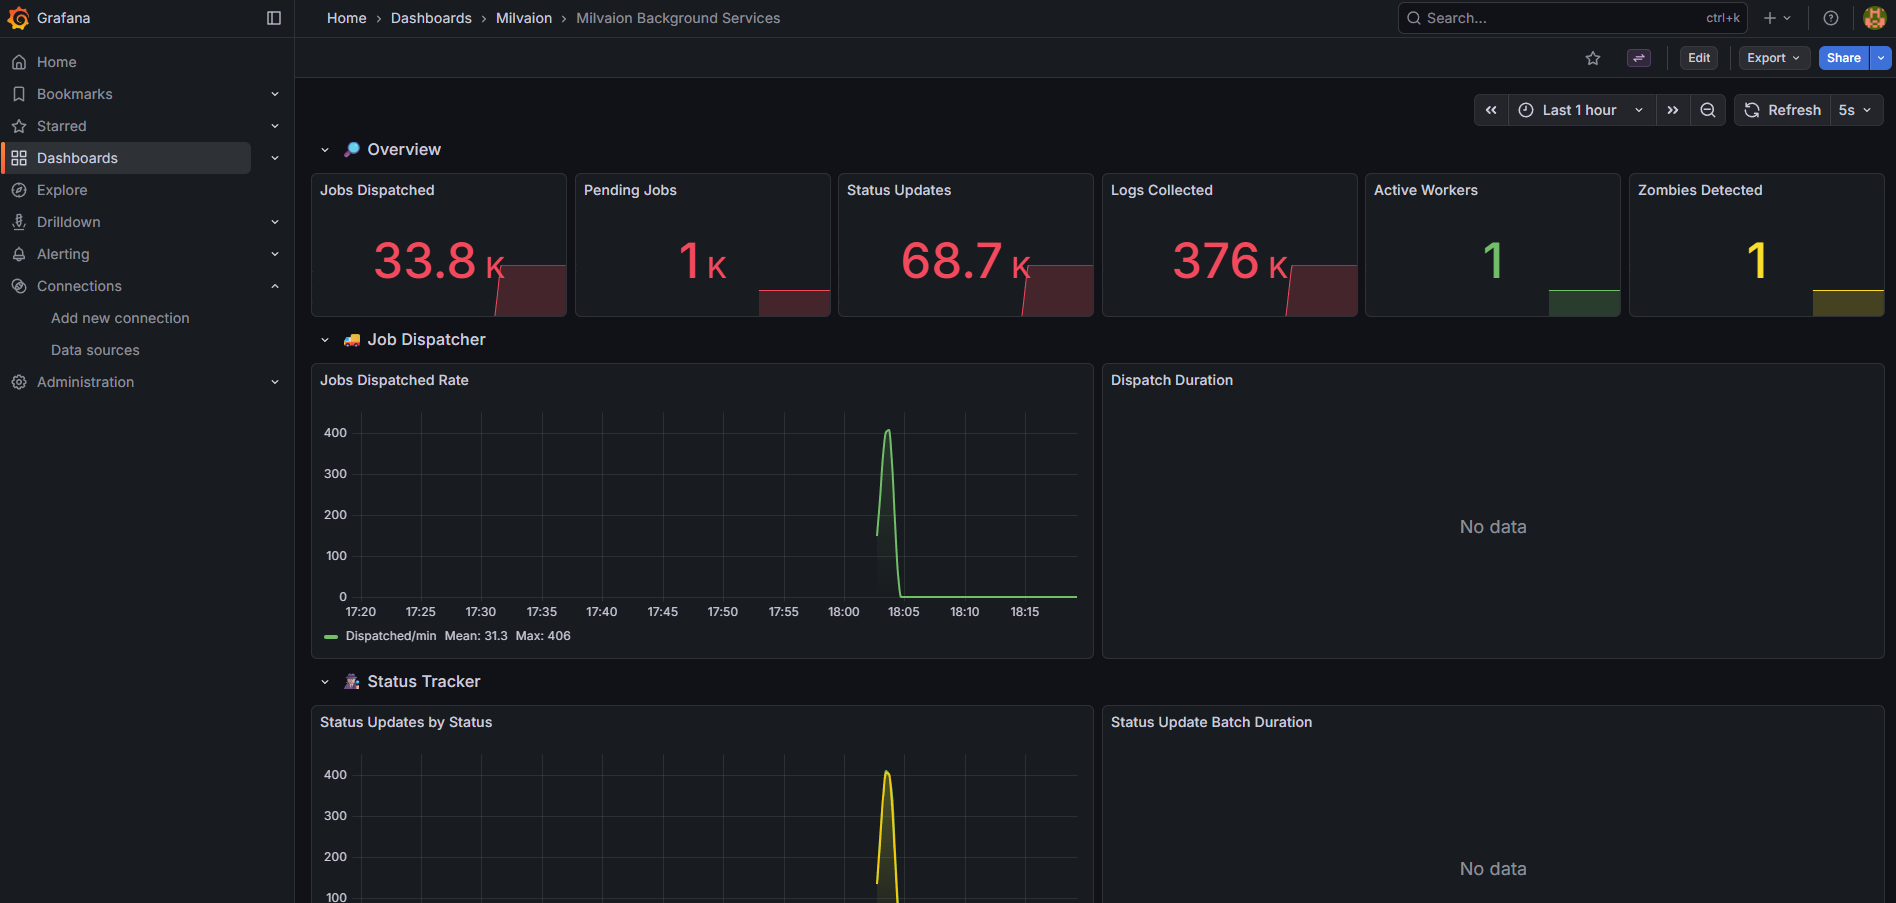
2. Background Services Dashboard (milvaion-background-services.json)
Dedicated monitoring for all background services:
| Section | Panels |
|---|---|
| Overview | Jobs Dispatched, Pending Jobs, Status Updates, Logs Collected, Active Workers, Zombies Detected |
| Job Dispatcher | Dispatch Rate (jobs/min), Dispatch Duration (p50/p95/p99), Failures |
| Status Tracker | Updates by Status, Batch Duration, Failures |
| Log Collector | Collection Rate, Batch Duration, Queue Size |
| Worker Discovery | Registrations/min, Heartbeats/min, Active Workers, Heartbeat Duration |
| Zombie & Failed Handlers | Zombies Detected/Recovered, Failed Occurrences Processed/Retried |
| Service Health | Errors by Service, Iteration Duration by Service |
Useful PromQL Queries
# Jobs dispatched per minute
rate(milvaion_dispatcher_jobs_dispatched_total{job="milvaion-api"}[1m]) * 60

# Dispatch failure rate
rate(milvaion_dispatcher_dispatch_failures_total[5m]) / rate(milvaion_dispatcher_jobs_dispatched_total[5m])

# Status updates by status type
sum by (status) (rate(milvaion_status_tracker_updates_by_status_total[5m]))

# Average dispatch duration (p95)
histogram_quantile(0.95, sum(rate(milvaion_dispatcher_dispatch_duration_bucket[5m])) by (le))

# Active workers count
milvaion_worker_discovery_active_workers

# Zombie detection rate (per 5 minutes)
increase(milvaion_zombie_detector_detected_total[5m])

# Service error rate by service
sum by (service) (rate(milvaion_background_service_errors_total[5m]))
Access Dashboards
- Grafana UI: http://localhost:3000 (default: admin/admin)
- Milvaion API Dashboard: Pre-loaded as "Milvaion API Dashboard"
- Background Services Dashboard: Pre-loaded as "Milvaion Background Services"
RabbitMQ Monitoring
Management UI
Access at http://localhost:15672:
- Overview: Message rates, connections
- Queues: Depth, consumers, message rates
- Exchanges: Routing statistics
Key Metrics
| Metric | Healthy Range | Action if Exceeded |
|---|---|---|
| Queue depth | < 1000 | Scale workers |
| Unacked messages | < 100 | Check worker health |
| Memory usage | < 80% | Add RAM or scale |
| Disk alarm | Not triggered | Add disk space |
CLI Monitoring
# Queue status
docker exec milvaion-rabbitmq rabbitmqctl list_queues name messages consumers

# Connection count
docker exec milvaion-rabbitmq rabbitmqctl list_connections
Queue Depth Monitoring (IQueueDepthMonitor)
Milvaion includes a built-in IQueueDepthMonitor service that tracks queue depths and health status. When the RabbitMQ Management HTTP API is enabled, it provides richer statistics — including unacknowledged message counts — and automatically discovers dynamic consumer queues (e.g. scheduled_jobs_queue.SampleWorker) that are created at runtime when workers bind to the exchange.
Configuration
Enable Management API integration in appsettings.json:
{
  "MilvaionConfig": {
    "RabbitMQ": {
      "ManagementEnabled": true,
      "ManagementPort": 15672
    }
  }
}
| Setting | Default | Description |
|---|---|---|
ManagementEnabled | false | Enable RabbitMQ Management HTTP API integration |
ManagementPort | 15672 | Management plugin HTTP port |
QueueDepthWarningThreshold | 5000 | Message count that triggers a Warning health status |
QueueDepthCriticalThreshold | 10000 | Message count that triggers a Critical health status |
Note: The Management API uses the same
UsernameandPasswordcredentials configured underMilvaionConfig:RabbitMQ.
How it Works
| Scenario | Behavior |
|---|---|
ManagementEnabled: true | Uses GET /api/queues/{vhost}/{queue} for individual queue stats |
ManagementEnabled: true | Uses GET /api/queues/{vhost} to discover all queues, including dynamic routing-key queues |
ManagementEnabled: false or API unavailable | Falls back to AMQP passive queue declare (core queues only, MessagesUnacknowledged will be 0) |
Queue Health Statuses
| Status | Condition |
|---|---|
Healthy | Message count below warning threshold |
Warning | Message count ≥ QueueDepthWarningThreshold |
Critical | Message count ≥ QueueDepthCriticalThreshold |
Unavailable | Queue or broker unreachable |
API Endpoints
Retrieve queue stats via the Admin API:
# All queues (includes dynamic consumer queues when Management API is enabled)
curl http://localhost:5000/api/v1/admin/queues

# Single queue depth
curl http://localhost:5000/api/v1/admin/queues/{queueName}
Example response for a single queue:
{
  "queueName": "scheduled_jobs_queue",
  "messageCount": 42,
  "consumerCount": 3,
  "messagesReady": 40,
  "messagesUnacknowledged": 2,
  "healthStatus": "Healthy",
  "healthMessage": "Queue operating normally",
  "timestamp": "2026-01-14T18:10:00.000Z"
}
Dynamic queues: Without Management API enabled, only the 8 core queues (
jobs,worker_logs,worker_heartbeat,worker_registration,status_updates,failed_occurrences,external_job_registration,external_job_occurrence) are monitored. With it enabled, all queues in the vhost — including per-worker routing-key queues likescheduled_jobs_queue.SampleWorker— are returned automatically.
Redis Monitoring
Key Metrics
| Metric | Command | Healthy Range |
|---|---|---|
| Memory used | INFO memory | < 80% maxmemory |
| Connected clients | INFO clients | < 10000 |
| Commands/sec | INFO stats | Varies |
| Keyspace | INFO keyspace | Growing slowly |
CLI Commands
# Memory info
docker exec milvaion-redis redis-cli INFO memory

# Slow queries
docker exec milvaion-redis redis-cli SLOWLOG GET 10

# Active keys
docker exec milvaion-redis redis-cli DBSIZE
Database Monitoring
PostgreSQL Key Metrics
| Metric | Query | Threshold |
|---|---|---|
| Active connections | SELECT count(*) FROM pg_stat_activity | < max_connections |
| Long-running queries | SELECT * FROM pg_stat_activity WHERE state = 'active' AND query_start < now() - interval '5 minutes' | 0 |
| Table bloat | SELECT pg_size_pretty(pg_total_relation_size('JobOccurrences')) | Monitor growth |
Useful Queries
-- Occurrence count by status (last 24h)
SELECT "Status", COUNT(*)
FROM "JobOccurrences"
WHERE "CreatedAt" > NOW() - INTERVAL '24 hours'
GROUP BY "Status";

-- Slowest jobs (avg duration)
SELECT j."JobType", AVG(o."DurationMs") as avg_ms, COUNT(*) as count
FROM "JobOccurrences" o
JOIN "ScheduledJobs" j ON o."JobId" = j."Id"
WHERE o."Status" = 2 -- Completed
GROUP BY j."JobType"
ORDER BY avg_ms DESC
LIMIT 10;

-- Failed jobs by type (last 7 days)
SELECT j."JobType", COUNT(*) as failures
FROM "JobOccurrences" o
JOIN "ScheduledJobs" j ON o."JobId" = j."Id"
WHERE o."Status" = 3 -- Failed
AND o."CreatedAt" > NOW() - INTERVAL '7 days'
GROUP BY j."JobType"
ORDER BY failures DESC;
Troubleshooting
Jobs Not Executing
- Check dispatcher is running:
docker logs milvaion-api | grep -i dispatch - Check workers are registered:
curl http://localhost:5000/api/v1/workers - Check RabbitMQ queues: http://localhost:15672
- Check Redis scheduled jobs:
docker exec milvaion-redis redis-cli ZRANGE "Milvaion:JobScheduler:scheduled_jobs" 0 -1 WITHSCORES
High Memory Usage
- Check for large job payloads
- Check occurrence log sizes
- Enable database cleanup jobs
- Check for memory leaks in custom jobs
Slow Dashboard
- Check PostgreSQL query performance
- Add indexes if missing
- Increase API connection pool
- Enable response caching
What's Next?
- Database Maintenance - Cleanup and retention policies
- Security – Security considerations
- MilvaionUI – UI screenshoots