Monitoring Hangfire and Quartz.NET Without Changing Them

· 9 min read
Ahmet Buğra Kösen
Software Developer

In the previous post I explained why I wrote Milvaion and how its architecture works. I closed with a promise: we'd look at how to add Milvaion's monitoring capabilities without changing your existing scheduler at all.

This post is exactly that. But first, let's talk about why I felt the need to build this in the first place.


Migration Is Genuinely Hard

When you release a new open-source tool, what you're really telling people is: "rip out the working system you have and install mine."

That's not something anyone wakes up wanting to do. Especially not for background jobs. If you have forty jobs that have been running flawlessly in Hangfire for five years, moving all of them for the sake of "a better dashboard" isn't a sensible risk/reward calculation. I wouldn't do it either.

But I also know this: there's an IT Operations team that wants to see what happened when one of those forty jobs failed at 3 a.m., and right now all they have is a Seq query.

These two things don't actually contradict each other. Monitoring and execution are separate concerns. Your jobs can keep running in Hangfire while everything that happens to them collects in Milvaion.

That's what External Scheduler Integration is for.


What It Does and Doesn't Do

Let's be precise, because this distinction matters:

It does:

  • List your jobs in the Milvaion dashboard
  • Record every run (occurrence) with its status, duration, exception, and which worker it ran on
  • Show logs you publish from inside the job, live, under that occurrence
  • Include them in metrics: EPM, average duration, success rate, status counters
  • Run alert rules — Slack/Teams/email notifications when a job fails

It doesn't:

  • Trigger the job. Hangfire or Quartz still owns scheduling.
  • Change its cron. That's your scheduler's decision.
  • Delete, cancel, or pause the job.

In the dashboard these jobs appear with an external badge, and the Trigger/Delete buttons come disabled. On the edit screen only Milvaion-owned fields are open: display name, description, tags, zombie timeout. Cron, job data, execution timeout, concurrent policy and similar fields are locked — because Milvaion doesn't manage them.

I made that choice deliberately. If you could change the cron from the dashboard but the real value in Hangfire stayed the same, you'd have a field on screen that lies to you. There's nothing worse than a system where two sources of truth disagree.


How Does It Work?

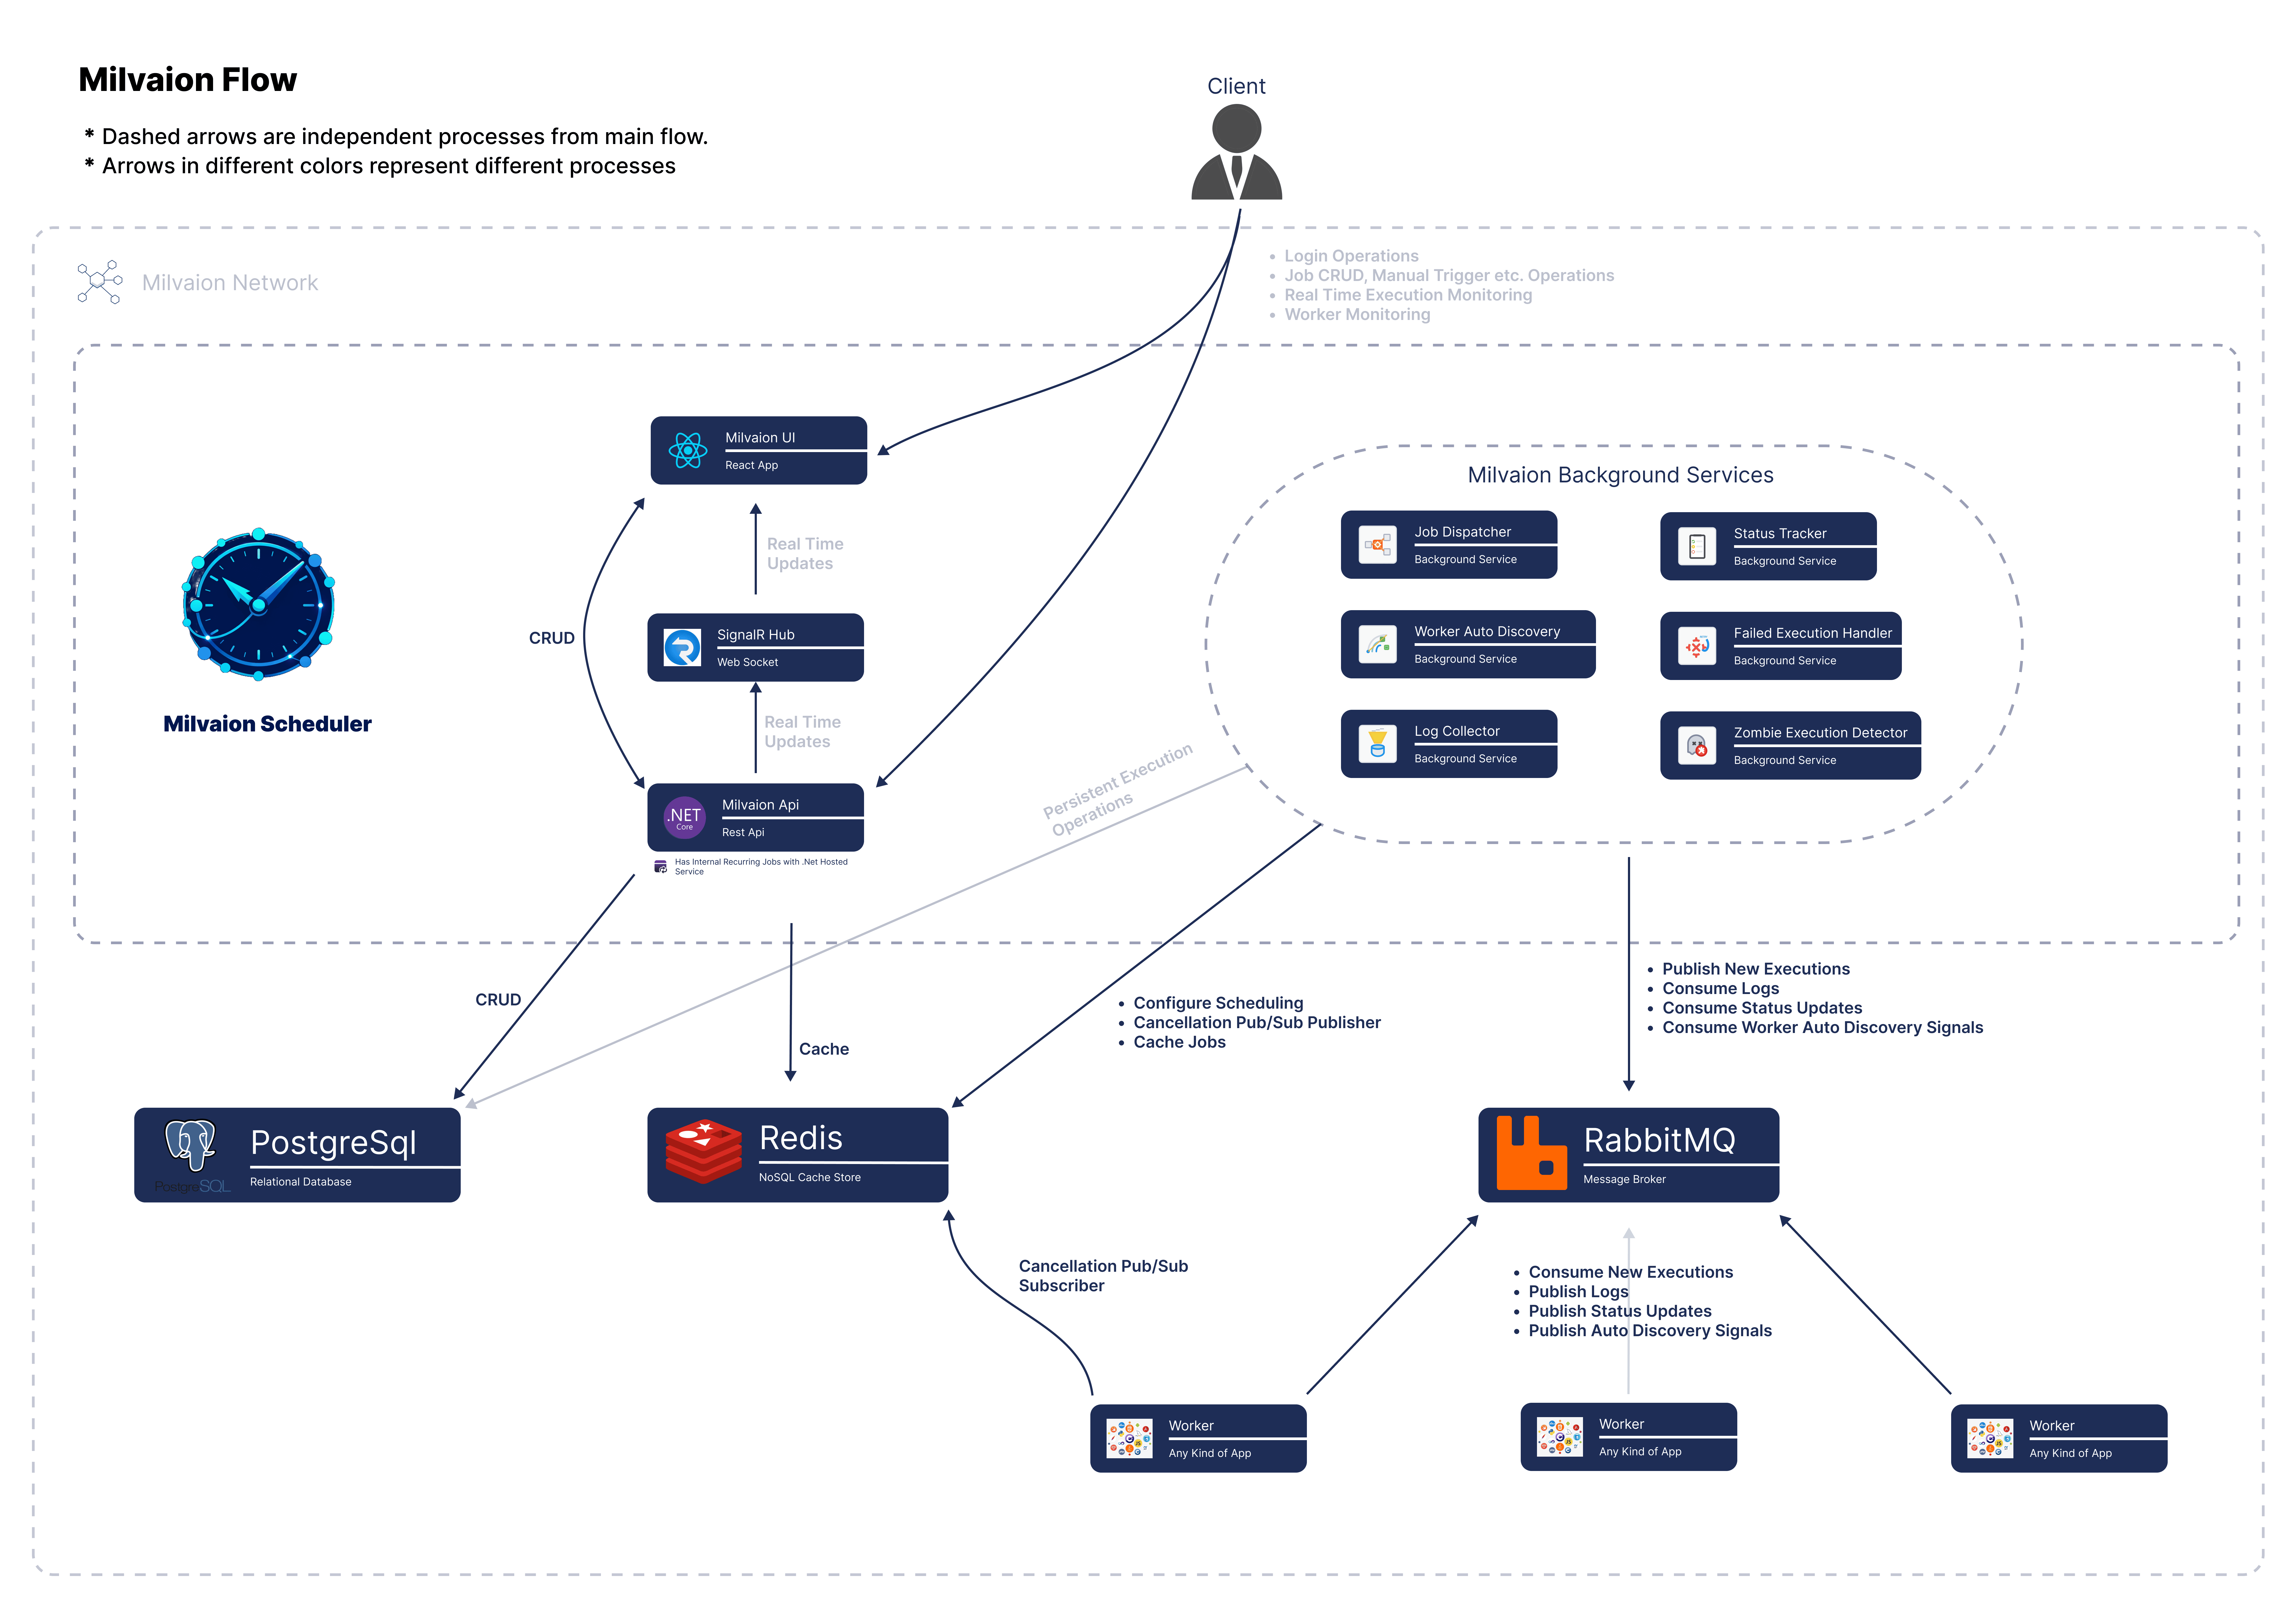
No surprises on the architecture side — it's a shortened version of the flow from the first post.

You add an SDK package to your application. On the Hangfire side that package registers a job filter; on the Quartz side, a job listener. When a job starts and finishes, the filter/listener kicks in and publishes the event to RabbitMQ as a message.

On the Milvaion side, ExternalJobTrackerService consumes those messages: the first time it sees a job it creates a ScheduledJob record flagged IsExternal = true, opens a JobOccurrence for each run, and updates its status, duration, and exception when the work finishes.

Your app (Hangfire/Quartz)
└── MilvaionJobFilter / MilvaionJobListener
└── RabbitMQ
└── ExternalJobTrackerService (Milvaion API)
├── ScheduledJob (IsExternal = true)
├── JobOccurrence (status, duration, exception)
└── Dashboard / Alerts / Metrics

The thing to notice: this flow is one-way. No command travels from Milvaion into your application. That's the answer to why this integration is so low-risk.

What if the integration fails?

I want to address this separately, because it's the first question people ask: "if it can't reach Milvaion, do my jobs stop?"

No. Every method inside the filter is wrapped in try-catch and logs silently on failure:

catch (Exception ex)
{
LogSafeError(ex, "OnPerforming", context?.BackgroundJob?.Job?.Type?.Name);
}

Message publishing is also fire-and-forget: your job's thread never waits on RabbitMQ. If RabbitMQ is down, the network drops, or the Milvaion API is unavailable, your job keeps running as if nothing happened. The only consequence is that the record for that run doesn't reach the dashboard.

Because you're bolting this onto an existing, working system, the design decision had to be unambiguous: the monitoring layer must never, under any circumstance, affect the execution layer.


Hangfire Integration

Let's get practical. Add the package first:

dotnet add package Milvasoft.Milvaion.Sdk.Worker.Hangfire

Then two lines:

using Hangfire;
using Milvasoft.Milvaion.Sdk.Worker.Hangfire.Extensions;

var builder = Host.CreateApplicationBuilder(args);

// Line 1 — register Milvaion services
builder.Services.AddMilvaionHangfireIntegration(builder.Configuration);

builder.Services.AddTransient<MyEmailJob>();

builder.Services.AddHangfire((sp, config) =>
{
config.UsePostgreSqlStorage(connectionString);

// Line 2 — plug the filter into Hangfire
config.UseMilvaion(sp);
});

builder.Services.AddHangfireServer(options =>
{
options.WorkerCount = 4;
options.Queues = ["default", "critical"];
});

await builder.Build().RunAsync();

That's all of it. AddMilvaionHangfireIntegration registers the core worker services (heartbeat, status reporting, log publisher) but not the job consumer — because this worker won't pull work from a queue; it only reports on Hangfire's own jobs. UseMilvaion adds MilvaionJobFilter to GlobalJobFilters.

Not a single line of your job code changes. MyEmailJob stays exactly as it is.

All that's left is configuration:

{
"Worker": {
"WorkerId": "hangfire-worker",
"MaxParallelJobs": 128,
"RabbitMQ": {
"Host": "rabbitmq",
"Port": 5672,
"Username": "guest",
"Password": "guest",
"VirtualHost": "/"
},
"Redis": {
"ConnectionString": "redis:6379"
},
"Heartbeat": {
"Enabled": true,
"IntervalSeconds": 5
},
"ExternalScheduler": {
"Source": "Hangfire"
}
}
}

The ExternalScheduler.Source field is critical. It's how Milvaion knows where these jobs came from, and it's the label they get in the dashboard.

Which events get captured on the Hangfire side?

MilvaionJobFilter implements three separate Hangfire interfaces at once:

InterfaceMethodWhat happens
IClientFilterOnCreating / OnCreatedThe job is registered with Milvaion (ExternalJobRegistrationMessage)
IServerFilterOnPerformingAn occurrence opens; a CorrelationId is generated and written to job parameters
IServerFilterOnPerformedDuration is calculated, status and exception are recorded
IElectStateFilterOnStateElectionIf the job moves to DeletedState, the occurrence is marked Cancelled

The CorrelationId generated in OnPerforming is written to Hangfire's job parameters under the name Milvaion_CorrelationId. We'll use it shortly to emit logs.


Quartz.NET Integration

Same story, different attachment point. Quartz has no filters — it has listeners:

dotnet add package Milvasoft.Milvaion.Sdk.Worker.Quartz
using Milvasoft.Milvaion.Sdk.Worker.Quartz.Extensions;
using Quartz;

var builder = Host.CreateApplicationBuilder(args);

builder.Services.AddMilvaionQuartzIntegration(builder.Configuration);

builder.Services.AddQuartz(q =>
{
// Enable the Milvaion listeners
q.UseMilvaion();

var myJobKey = new JobKey("MyJob", "MyGroup");

q.AddJob<MyJob>(opts => opts.WithIdentity(myJobKey)
.WithDescription("My scheduled job"));

q.AddTrigger(opts => opts.ForJob(myJobKey)
.WithIdentity("MyJob-Trigger")
.WithCronSchedule("0 0 * * * ?"));
});

builder.Services.AddQuartzHostedService(q => q.WaitForJobsToComplete = true);

await builder.Build().RunAsync();

q.UseMilvaion() registers two listeners:

  • MilvaionSchedulerListener — registers the defined jobs with Milvaion when the scheduler starts up.
  • MilvaionJobListener — opens an occurrence on JobToBeExecuted, closes it on JobWasExecuted.

On the appsettings.json side the only difference is the Source value:

"ExternalScheduler": {
"Source": "Quartz"
}

In Quartz the CorrelationId arrives via MergedJobDataMap rather than job parameters.


Live Log Streaming

Everything so far is entirely passive: execution history, durations, and exceptions land in the dashboard without you ever opening your job code.

But in the first post I said the thing that adds the most value is live log streaming. If you want that, it takes a small touch inside the job — you inject ILogPublisher:

using Hangfire.Server;
using Milvasoft.Milvaion.Sdk.Domain.JsonModels;
using Milvasoft.Milvaion.Sdk.Worker.RabbitMQ;

public class SendEmailJob(ILogger<SendEmailJob> logger, ILogPublisher logPublisher)
{
public async Task ExecuteAsync(PerformContext context, string recipient, CancellationToken ct)
{
// Read the tracking info written by the filter
var correlationIdStr = context.GetJobParameter<string>("Milvaion_CorrelationId");
var workerId = context.GetJobParameter<string>("Milvaion_WorkerId") ?? "hangfire-worker";
var correlationId = Guid.TryParse(correlationIdStr, out var cid) ? cid : Guid.Empty;

await logPublisher.PublishLogAsync(correlationId, workerId, new OccurrenceLog
{
Level = "Information",
Message = $"Sending email to {recipient}",
Timestamp = DateTime.UtcNow,
Category = "UserCode"
});

await SendAsync(recipient, ct);

// Flush the buffer before the job finishes
await logPublisher.FlushAsync(ct);
}
}

Two things:

  • No logs go out without a CorrelationId. If an empty Guid arrives, the publisher exits silently. If your logs aren't showing up, this is the first place to look.
  • FlushAsync is required. Logs are buffered for performance; if you don't flush before the job ends, the last lines can be lost.

Admittedly, this isn't as elegant as context.LogInformation(...) in Milvaion's own IAsyncJob. But passive monitoring requires nothing from you at all; log streaming is an optional step up. That's exactly the gradual-adoption idea.


The Quick Way to Try It

If you want to see it without touching your own project, there are pre-built images:

services:
hangfire-worker:
image: milvasoft/milvaion-sample-hangfire-worker:latest
environment:
- Worker__WorkerId=hangfire-worker-1
- Worker__RabbitMQ__Host=rabbitmq
- Worker__Redis__ConnectionString=redis:6379
- Worker__ExternalScheduler__Source=Hangfire
depends_on: [rabbitmq, redis]

quartz-worker:
image: milvasoft/milvaion-sample-quartz-worker:latest
environment:
- Worker__WorkerId=quartz-worker-1
- Worker__RabbitMQ__Host=rabbitmq
- Worker__Redis__ConnectionString=redis:6379
- Worker__ExternalScheduler__Source=Quartz
depends_on: [rabbitmq, redis]

Bring Milvaion up with docker compose up -d, add these, and look at the dashboard. The sample workers contain demo jobs that run every few seconds, so you'll see movement immediately.


Three Common Problems

Jobs don't show up in the dashboard at all. Check the RabbitMQ connection first (docker logs <worker> | grep -i rabbitmq), then make sure ExternalScheduler.Source is set. If it's empty, the filter returns early.

The job appears but occurrences hang in Running. It means the OnPerformed / JobWasExecuted message never arrived. That's normal if the application shut down mid-job — Milvaion's zombie detection will move these to Failed after a while. Zombie timeout is one of the few fields you can edit on external jobs, precisely for this reason.

Logs aren't streaming. Is ILogPublisher injected, is CorrelationId actually populated, was FlushAsync called? If any one of the three is missing, no logs appear.


What Does This Integration Actually Solve?

To be honest, there's nothing technically brilliant here. A filter, a listener, a few RabbitMQ messages. The code itself is one of the simplest parts of Milvaion.

But as a product decision, it's the piece I thought about the most.

Because Milvaion's real competitor isn't Hangfire or Quartz — it's doing nothing. Most people look at a new tool, say "that's nice," and close the tab, because the cost of trying it looks higher than the payoff of a dashboard. If you can see the result in two lines of code without putting any part of your existing system at risk, that calculation changes.

The rest is organic: you monitor in external mode for a while, get used to the dashboard, set up your alerts. One day when you need to write a new job, maybe you write it as an IAsyncJob. Maybe you never do, and Milvaion just stays an observability layer for you. Both are acceptable outcomes as far as I'm concerned.

Milvaion is open source on GitHub under Apache 2.0. For the full details of the external scheduler integration, take a look at the documentation.

See you in the next one…
Asking Your Scheduler Questions — The Milvaion MCP Server

· 10 min read
Ahmet Buğra Kösen
Software Developer

In the first post of this series I covered where Milvaion came from, and in the second how to monitor existing Hangfire/Quartz installations without changing them.

This post is about the newest addition to the system, and the one I argued with myself about the most: the MCP server.

Fair warning up front — this isn't an "AI solved everything" post. If anything, the part I spent the most time on while building this wasn't what it can do, but what it can't.


A Second Door to the Same Data

In the first post I said the real value isn't in running jobs, it's in seeing what happens after they run. The dashboard exists for exactly that, and it's the part I spent the most time on.

The MCP server doesn't replace it. The dashboard is still where you manage the system, build your workflows, edit a job, and watch logs stream live — and that's staying. What MCP adds is a second door to the same data: for the moments when you'd rather ask than look.

Here's where the difference shows up. The dashboard is very good at answering a question. A diagnosis, though, is usually not one question but a chain of them, each triggered by the last:

daily-invoice-export failed overnight. You read the exception on the occurrence screen — a timeout. Then you look back through history to ask "how long has this been happening?" Since Tuesday. Then you move to the worker screen for "was the worker even up on Tuesday?", then to the activity log for "did someone touch this job on Tuesday?"

Every one of those screens gives you the right answer. The part that strains is you: assembling the pieces you gathered from four screens in your head. By the fourth, you're trying to remember what you saw on the first.

Meanwhile the question in your head was one sentence the whole time: "daily-invoice-export has been failing since Tuesday, read the logs and tell me what changed."

The MCP server makes that sentence directly executable. It doesn't remove the navigating — it removes the cost of carrying context while you navigate.

Which door to use when is straightforward too: if you're going to change something, the dashboard. If you're trying to understand something, either works — whichever is faster in the moment.


Which Way Round Does This Work?

I'm giving this its own heading because most people get it backwards.

Your machine                          Your Milvaion server
┌────────────────────────┐ ┌──────────────────┐
│ Claude Code / Cursor / │ │ Milvaion API │
│ Copilot │ ──MCP──▶ │ /mcp │
│ │ │ │
│ • the model runs here │ ◀──JSON── │ • jobs │
│ • your subscription │ │ • logs │
│ • your tokens │ │ • metrics │
└────────────────────────┘ └──────────────────┘

Milvaion never calls a language model. No OpenAI, Anthropic, or Google key is stored on the server, no tokens are consumed, no outbound request is made.

Milvaion is purely the data source here. The model runs in your editor, on your subscription. The only credential involved is a Milvaion API key, which your editor uses to authenticate to Milvaion.

That distinction wasn't marketing detail for me, it was an architectural decision. If I had put an LLM integration inside Milvaion, I'd owe an enterprise team an answer to "which provider is this tool sending our job logs to." The current answer is simple: none of them. The data never leaves your network; you're the one making the model call, through an editor you already trust.


Setup

1. Create a read-only API key

Create an API key from the dashboard and grant only:

  • ScheduledJobManagement.List, ScheduledJobManagement.Detail
  • FailedOccurrenceManagement.List
  • WorkerManagement.List
  • WorkflowManagement.List

With this set, the assistant can investigate anything and change nothing. For most people, that's the right default.

2. Register the server in your editor

Milvaion is a remote HTTP MCP server, so any client supporting streamable HTTP transport can connect. In Claude Code you don't even need to edit a file:

claude mcp add --transport http milvaion \
https://milvaion.yourcompany.com/mcp \
--header "X-ApiKey: $MILVAION_API_KEY"

For Cursor, .cursor/mcp.json:

{
"mcpServers": {
"milvaion": {
"type": "http",
"url": "https://milvaion.yourcompany.com/mcp",
"headers": { "X-ApiKey": "your-api-key" }
}
}
}

There's an annoying reality here: every client wants the same thing under different key names. VS Code/Copilot expects the top-level key to be servers, not mcpServers. Windsurf says serverUrl, not url. Gemini CLI wants httpUrl.

This is the number one cause of "it connected but no tools show up." The number two cause is Copilot's chat not being switched to Agent mode — in Ask mode, MCP tools never appear at all.

The documentation has a full client matrix, along with the quirks specific to Claude Desktop and ChatGPT.

Don't put the key in the repository. Every client above supports either environment variable expansion or a runtime prompt. A config file with a live key in it gets committed eventually, and a key in git history means creating a new one and revoking the old.

3. Ask something

Which jobs failed last night?

daily-invoice-export has been failing since Tuesday. Read the logs and tell me what changed.

Is there a worker alive that can run SendReportJob?


What Does It Look Like in Practice?

When you ask the first question, the assistant doesn't call a single tool. The typical flow:

list_failures pulls the dead letter records → it sees multiple records for the same job and reaches for list_occurrences to look at history → it finds when the failures started → get_occurrence pulls that run's logs and exception detail → list_workers checks whether the worker was even alive at the time → list_activity_logs checks whether anyone touched the job around that date.

In other words, it builds the same chain you'd walk screen by screen in the dashboard, in the same order. The difference is that you don't have to hold the context.

Let me be clear about one thing: this isn't magical diagnosis. The assistant reads whatever is in the logs — the exact same data you see in the dashboard. But connecting "the first date I see this exception" to "what's in the activity log on that date" is something it does faster than a human at 9 a.m. who hasn't had their coffee.

And once you have the answer you usually head back to the dashboard anyway — because fixing the job, changing the cron, or re-triggering it happens there.


Tools and the Permission Model

There are 40+ tools, each gated by a permission. Roughly grouped:

GroupExamples
Readingget_overview, list_jobs, get_job, list_occurrences, get_occurrence, list_failures, list_workers, search_logs, summarize_logs, get_latest_report, list_activity_logs
Systemget_system_health, get_queue_stats, get_database_statistics, get_configuration
Runningtrigger_job, cancel_occurrence, set_job_active, trigger_workflow
Editingcreate_job, update_job, resolve_failures
Deletingdelete_job, delete_occurrences, delete_failures, delete_worker

The design decision here: you don't choose which tools are exposed, you choose what the key can do.

With a key granted only List and Detail, the assistant is left with fifteen reading tools and nothing else. When it calls a tool it lacks permission for, the error names the missing permission — so instead of blindly retrying, the model can tell you "you need to grant this."

One detail that's easy to miss but matters: get_occurrence returns the tail of the log rather than all of it, defaulting to the last 100 lines (raise it with logLines). A job that logs inside a loop could otherwise fill an assistant's entire context in a single call.


Prompts — More Important Than I Expected

Three prompt templates ship with the server:

PromptWhat it does
diagnose_jobWalks a failing job in order: failures, pattern, logs, worker health, then recent config changes
overnight_reviewReviews a given window and groups failures by cause rather than listing them one by one
explain_workflowDescribes a workflow's steps, branching, and data flow in plain language

At first glance these look like canned questions, but their function is different. Left to itself, a model tends to start with whichever tool it read first — it calls list_jobs and browses the job list, when the answer was in list_failures.

The prompts put a working order in front of the model. The difference is between the right answer, and the right answer three extra tool calls later.


What I Deliberately Left Out

I think this is the most important section of the post.

There are no tools at all for user management, roles, permissions, API keys, dispatcher control, or configuration management. No matter what you grant the key, none of it is reachable over MCP. The reason is simple: an assistant being able to mint a new API key or widen its own permissions is a scenario I don't even want to think about.

Workflow creation and editing are absent too. Building a directed graph with conditions and data mappings through tool calls is technically possible, but the right place for it is the visual builder. A workflow built on an assistant's guess of "I think you wanted to connect these two nodes" is not something anyone wants in production.

A few more security details:

  • Side effects are attributed. Anything triggered, cancelled, or marked resolved through MCP is logged with the key's name. The history preserves the answer to "was this a human or an assistant?"
  • Concurrency policies are never bypassed. trigger_job always dispatches with force disabled. Overriding a job's concurrency policy stays a deliberate human action in the dashboard.
  • Fields can't be cleared by accident. update_job only changes the arguments it's given; an omitted field is left alone rather than blanked.

And the part where I have to be honest:

The tool descriptions tell the model to "confirm before doing this" and to "prefer set_job_active over delete_job." But those are prompts, not guarantees. I can't promise you the model will follow them.

So my advice is unambiguous: grant Create, Update, and Delete only where you'd be comfortable giving a person the same access through the dashboard. Trigger causes real work to run. Delete is irreversible. In every other case, a read-only key is the right answer.


Verifying It Works

/mcp speaks JSON-RPC over HTTP, so you can test it with curl before involving a client at all:

curl -X POST http://localhost:5000/mcp \
-H "Content-Type: application/json" \
-H "Accept: application/json, text/event-stream" \
-H "X-ApiKey: $MILVAION_API_KEY" \
-d '{"jsonrpc":"2.0","id":1,"method":"tools/list"}'

Drop the header and the same request returns 401 — the quickest confirmation that the endpoint is protected.

The server runs in stateless mode; any API replica can serve any request, and no sticky sessions are needed behind a load balancer. The cost of that is that features requiring a persistent session — sampling, elicitation — aren't supported.


Conclusion

The question I asked myself while building the MCP server wasn't "how do I add AI to this." It was: how do I make a question that's already one sentence in my head askable in one sentence?

That the answer turned out to be MCP is partly a matter of timing — the protocol exists, and most teams already have Claude Code or Cursor open. All Milvaion had to do was expose its data to that ecosystem properly. Being a data source instead of writing my own LLM integration means less code and less responsibility.

The interesting part is this: most of the time I spent on this feature didn't go into adding tools, it went into deciding which ones not to add. Opening a natural language interface onto a scheduler is easy; keeping it safe in production is the actual work.

Milvaion is open source on GitHub under Apache 2.0. For the full tool list, client configurations, and security model of the MCP server, take a look at the documentation.

See you in the next one…

Why I Wrote a Distributed Job Scheduler

· 14 min read
Ahmet Buğra Kösen
Software Developer

When it comes to background jobs in .NET, the first two names that come to mind are obvious: Hangfire and Quartz.NET. Both are mature, both have been in production for years. So why did I sit down and write a job scheduler when those already exist?

Short answer: I had no problem with either of them. The problem started with where the jobs run. But it didn't end there — the longer story is about the gaps I discovered after solving that first problem.

In this post I'll walk through that initial problem first, then look at how Milvaion answers it.


The Problem: Jobs Run Inside Your Application

When you add Hangfire or Quartz to a project, the scheduler lives inside your application's process. A job whose time has come runs in the same process, on the same thread pool.

That's perfectly fine for most workloads. Until one of these happens:

  • A long-running job holds everything else up. If your nightly report job takes two hours, it takes a share of the thread pool for those two hours.
  • A crashing job takes the scheduler down with it. An unhandled exception or a memory leak inside a job affects not just that job, but your entire application.
  • Different jobs need different hardware. A job running an ML model wants a GPU; a job sending emails is happy with 128 MB of RAM. If both live in the same process, you scale to the needs of the most expensive one.
  • Jobs scale together with the API. When API traffic spikes and you bump your pod count to three, your jobs go to three as well. That's usually not what you want.

In my case, all four applied. At some point I realized what I actually wanted was to decide where jobs run, separately.


What Is Milvaion?

Milvaion is an open-source (Apache 2.0) distributed job scheduling system built on .NET 10. Its core idea in one sentence:

The place that decides when a job runs doesn't have to be the same process that runs it.

It splits into two parts:

  • Scheduler (API): Reads cron expressions, detects jobs that are due, and enqueues them. It also hosts the dashboard.
  • Worker: Picks up the message from the queue, executes your IAsyncJob code, and reports the result back.

RabbitMQ, Redis, and PostgreSQL sit in between.

Milvaion Dashboard

In practice this means: you deploy the worker separately, scale it separately, and put it on separate hardware. A GPU-backed worker for GPU-hungry jobs, a 128 MB worker for email. If a worker crashes, the scheduler is unaffected and the message waits in the queue.


Core Concepts

There are four words you'll run into while navigating Milvaion — let's define them up front:

ConceptWhat It Means
JobA recurring or one-off work definition. "Send a report every morning at 9" is a job.
Worker JobYour C# class implementing IAsyncJob. The code that does the actual work.
OccurrenceA single run of a job. It has a status, a duration, and logs.
WorkerThe process that executes jobs.

A job is a definition; an occurrence is one run of that definition. When the dashboard says "this job ran 340 times, 3 of them failed," it's talking about occurrences.


How Does It Work?

The flow goes like this:

  1. Worker Auto Discovery automatically finds your worker and the job classes inside it.
  2. You create a job from the dashboard or the REST API.
  3. The scheduler writes it to PostgreSQL and adds it to a Redis ZSET with its next run time.
  4. The Dispatcher checks Redis and finds the jobs that are due.
  5. Due jobs are published to RabbitMQ with a routing key.
  6. The worker receives the message and runs your IAsyncJob code.
  7. The worker reports status and logs back over RabbitMQ.
  8. The scheduler records the result and pushes it to the dashboard in real time via SignalR.

I used a Redis ZSET for scheduling because the query "give me every job due up to now" is extremely cheap on a ZSET. Instead of polling the database every second, I ask Redis.


Writing a Worker

Enough theory — let's look at code. First, install the template:

dotnet new install Milvasoft.Templates.Milvaion
dotnet new milvaion-console-worker -n MyCompany.MyWorker

Then write a job:

using Milvasoft.Milvaion.Sdk.Worker.Abstractions;

public class SendReportJob(IReportService reportService) : IAsyncJob
{
public async Task ExecuteAsync(IJobContext context)
{
context.LogInformation("Preparing report...");

// The JSON payload entered from the dashboard, strongly typed
var data = context.GetData<ReportRequest>();

await reportService.GenerateAsync(data, context.CancellationToken);

context.LogInformation("Report sent.");
}
}

Three things worth noting:

  • Constructor injection works. The worker is a regular .NET host, so whatever you put in the DI container is available inside your job.
  • context.LogInformation lines show up live in the dashboard under that occurrence. Technical logs also go to Seq.
  • context.CancellationToken matters. This is the token triggered when you cancel a job from the dashboard or when it hits its timeout. If you don't pass it down in long-running work, the job can't be cancelled.

When you run the worker, auto discovery kicks in and SendReportJob becomes selectable in the dashboard. No registration step needed.


The Real Point Wasn't Being Distributed

Everything so far was Milvaion's starting point. But let me be honest: if all it did was run jobs in a separate process, this post probably wouldn't be worth writing.

What I noticed after separating the scheduler was this — the part that actually eats your time isn't where a job runs, it's what happens after it runs. The job failed, an email arrived, now what? Where's the log? Which worker was it on? Did it fail yesterday too? Who changed this?

In Hangfire and Quartz, the answer to those questions is usually "check Seq" or "query the database" — answers aimed at people with deeper technical knowledge. At my current company, for example, I watched our IT Operations team struggle to understand and use our existing Hangfire-based scheduler. Most of the features that emerged over time were written to close that gap. The only tool I've seen in the market with this kind of end-to-end coverage is temporal.io. Rather than adopting and learning that enormous ecosystem, I decided to build something from scratch that's lighter, developer-friendly, and fully under my control :)

Dashboard

This is one of the parts I spent the most time on. Quartz.NET has no built-in UI — you install something third-party or write your own. Hangfire has one and it does the job, but its scope is fixed: job list, retry, recurring jobs.

Milvaion's dashboard does the following:

  • Live log streaming. While a job runs, context.LogInformation lines land on screen over SignalR. You don't wait for it to finish and go dig in Seq.
  • Occurrence history. Duration, status, exception, and which worker ran it, for every run. Filterable, cursor-paginated — it still opens on a job with 30,000 records.
  • Worker health. Which workers are up, how many jobs they're running, their capacity, when their last heartbeat arrived. With the MCP server you can get answers to these questions through AI and manage the whole system ;)
  • Editing jobs from the UI. Change the cron, pause, trigger, update job data. No deployment required.
  • Enterprise management. RBAC-based role management, user management, auditing, API key management, MCP server, failure tracking — plenty of screens that let you manage the whole system no-code through the UI.

None of these individually makes you say "wow." But when a job fails at 3 a.m., having all of them on the same screen versus not makes a serious difference.

Workflow Engine (DAG)

Hangfire has ContinueJobWith, so you can chain "run this when that finishes." Quartz has no equivalent; you build it yourself.

I honestly didn't want to build a workflow engine — robust tools like n8n already exist. But job chaining had to be part of the system, and job chaining eventually leads here anyway. So if we're doing chaining, let's do it properly :)

Milvaion has a visual DAG builder. You drag and connect steps; a condition node branches on a condition, a merge node brings branches back together, and data mapping wires one step's output into the next. When a step fails, you can see on screen exactly which steps didn't run.

A flow like "fetch the data first, process it if successful, raise an alarm on error, send the report after both" gets built without three separate jobs and hand-written control code between them.

Alerting

When a job fails, someone needs to know. Milvaion has alert channels built in: Google Chat, Microsoft Teams, Slack, email, and in-app notifications.

On the Hangfire and Quartz side you typically write this yourself — an IJobFilter or a listener, then an HTTP client, then rate limiting, and before long it's a small project.

Auto Disable

This is my favorite small feature. It automatically disables a job that keeps failing, once it crosses a threshold you set.

Why it matters: a job with a broken connection string running every 5 minutes fails 96 times overnight and generates 96 alerts. You arrive in the morning to 96 emails and can't find the one that actually matters. Auto disable says "if it failed 3 times in a row, stop and tell someone."

You configure the threshold and the failure window per job — so you can say "3 times within the last 30 minutes," and errors from last week don't count toward the total.

Zombie Detection and Timeouts

When a worker crashes, occurrences get stuck in Running status. Milvaion detects these and moves them to Failed. There are two separate timeouts:

  • Execution timeout: If a job runs longer than N seconds, the worker triggers the cancellation token.
  • Zombie timeout: If a job has been queued or appears to be running for N minutes, it's considered dead.

Concurrent Execution Policy

What should happen when a job is due again while its previous run is still going? In Milvaion you choose this per job: skip the new one, queue it, or run them in parallel.

In Hangfire you do this in code with the DisableConcurrentExecution attribute, in Quartz with [DisallowConcurrentExecution]. Both are compile-time decisions; in Milvaion you change it from the UI.

RBAC, Users, and API Keys

The moment you open the dashboard to your team, the "who can delete what" question arrives. Milvaion has role-based authorization with granularity at the job/worker/dashboard level. You can give someone view-only access and be sure they can't touch production.

There's also API key support for CI pipelines, scripts, and automation — no user account needed. You scope what a key can do by permission, and keys can be revoked or given an expiry date.

Hangfire's dashboard ships without authorization by default; you write an IDashboardAuthorizationFilter. In Quartz there's no dashboard, so there's no question to answer.

Metric Reports

A reporter worker running in the background produces regular reports: error rate trends, duration percentiles (p50/p95/p99), slowest jobs, worker throughput, and utilization.

These show up as charts in the dashboard. You can answer "did this job get slower over the past week" by looking, without writing a query.

MCP Server — Asking Your Scheduler Questions

This is the newest addition. Milvaion also runs as an MCP (Model Context Protocol) server. You can connect Claude Code, Cursor, or GitHub Copilot to Milvaion and ask your scheduler questions in plain language.

There are 40+ tools: listing jobs, execution history, reading logs, dead letter records, worker health, triggering, pausing, editing. Each one sits behind its own permission — with a read-only API key, the assistant can inspect everything and change nothing.

One important note: Milvaion is the data source here. No model provider keys are stored server-side, and no outbound calls are made. The model runs in your editor, on your subscription.

In practice it looks like this: you ask "which jobs failed last night and why," and the assistant starts with list_failures, pulls logs with get_occurrence, and summarizes for you.

Monitoring Hangfire and Quartz

The last one is a bit of a twist: Milvaion can monitor your Hangfire and Quartz.NET installations.

With two lines of code you connect your existing scheduler to Milvaion read-only. Your jobs keep running in Hangfire, but execution history, logs, metrics, and alerts all collect in the Milvaion dashboard. No migration, no changes to your job code.

Here's why I built it: Milvaion's goal was never to compete with Quartz and Hangfire, which are industry standards. For a brand-new open-source tool, entering that competition makes no sense anyway. Migrating to Milvaion will be hard for people already running these libraries in their systems, so this integration exists to make that transition organic and to serve as an onboarding path that shows users what Milvaion can do.


What About Reliability?

Once you go distributed, the "did the message get lost?" question inevitably arrives. Milvaion's answers:

  • At-least-once delivery: RabbitMQ manual ACK. The worker doesn't ACK until the work is done, so if it crashes mid-job the message goes back on the queue.
  • Automatic retry: With exponential backoff. You configure the retry count per job.
  • Dead Letter Queue: Jobs that exhaust their retries land in the DLQ rather than disappearing. They're listed on a separate dashboard screen.
  • Offline resilience: If a worker can't reach RabbitMQ, it writes results to a local SQLite database and sends them when the connection comes back.

Things to Watch Out For

To be honest, Milvaion isn't the right tool for every scenario. Use something else in these cases:

  1. Single application, single server. If the cost of standing up PostgreSQL + Redis + RabbitMQ outweighs what you gain, Hangfire is the far better choice.
  2. Sub-second scheduling. The dispatcher checks at most once per second. If you need millisecond precision, look elsewhere.
  3. Event processing. If you need "run this when that event arrives," that's not a scheduler's job; Kafka or something similar fits better.
  4. .NET Framework. Milvaion targets .NET 10. If you have a legacy application, Hangfire and Quartz offer much broader TFM support.

On the other hand, it genuinely helps when your jobs are spread across multiple services, when you have long-running work, when different jobs need different hardware, when you want a modern application and architecture, or when you need a complete execution history for auditing.


Conclusion

I didn't write Milvaion to build "a better Hangfire." I wanted to separate scheduling from execution, because that was exactly the problem in front of me.

But what the work taught me was this: making that separation was only the beginning. The real value is in being able to see what happens to jobs after they run — in the dashboard, the alerts, the reports, and small details like auto disable that save your sleep.

What came out of it runs on .NET 10, is Apache 2.0 licensed, and is open source on GitHub. It comes up in five minutes with Docker Compose:

git clone https://github.com/Milvasoft/milvaion.git
cd milvaion
docker compose up -d

The dashboard will be waiting for you at http://localhost:5000.

You can spin it up right now and explore every feature yourself, or take a look at the documentation.

In this post I covered the core architecture and features. In the next post in the series, we'll look at how to add Milvaion's monitoring capabilities without changing your existing Hangfire or Quartz.NET setup at all — because you don't have to migrate to adopt Milvaion.

See you in the next one…
UnitsNet

· 3 min read
Ahmet Buğra Kösen
Software Developer

Unit conversions can be challenging in applications working with physical quantities. The UnitsNet library, developed for the .NET platform, makes conversions between different measurement systems and physical quantities easy and reliable. In this article, we'll explore the features and use cases of the UnitsNet library.

What is UnitsNet?

UnitsNet is an open-source library developed to perform unit conversions of physical quantities in .NET applications in a simple and reliable way. It supports many measurement types and enables conversions between different units. For example, operations like getting a length in meters as kilometers or converting a weight in kilograms to pounds are extremely easy with UnitsNet.

Supported Unit Types

The UnitsNet library supports a wide range of physical quantities and units. These quantities include:

  • Length: meter, kilometer, mile, inch, foot, etc.
  • Mass: kilogram, gram, ton, pound, etc.
  • Temperature: Celsius, Fahrenheit, Kelvin, etc.
  • Volume: liter, milliliter, gallon, cubic meter, etc.
  • Area: square meter, hectare, acre, etc.
  • Pressure: Pascal, bar, atm, psi, etc.
  • Speed: meter/second, kilometer/hour, mile/hour, etc.
  • Energy: joule, calorie, kilowatt-hour, etc.
  • Power: watt, kilowatt, horsepower, etc.
  • Information: byte, kilobyte, megabyte, gigabyte, terabyte, etc.

UnitsNet provides support for the above quantities and more, making it suitable for a wide variety of engineering and scientific calculations.

UnitsNet Implementation

First, let's add the UnitsNet NuGet package to the project:

dotnet add package UnitsNet

Defining a quantity and converting it to different units with UnitsNet is quite simple:

using UnitsNet;

class Program
{
static void Main()
{
// Define 10km
var distance = Length.FromKilometers(10);

Console.WriteLine($"Meters: {distance.Meters}");
// Meters: 10000

Console.WriteLine($"Miles: {distance.Miles}");
// Miles: 6.2137119223733395

Console.WriteLine($"Yard: {distance.Yards}");
// Yard: 10936.132983377078


// Define 100 MB
var fileSize = Information.FromMegabytes(100);

Console.WriteLine($"Byte: {fileSize.Bytes}");
// Byte: 100000000

Console.WriteLine($"Gigabyte: {fileSize.Gigabytes}");
// Gigabyte: 0.1
}
}

In this code, we define a length of 10 kilometers with Length.FromKilometers(10) and display its values in different units using properties like distance.Meters and distance.Miles. We also convert a 100 MB file size to bytes and gigabytes.

For more information, please check out the project's GitHub page...

Things to Consider When Using UnitsNet

It's useful to pay attention to the following points during usage:

  1. Choosing the Right Quantity: There's a separate class for each quantity (like Length, Mass, Temperature). Make sure you choose the correct quantity to use.
  2. Unit Precision: UnitsNet may perform rounding in some unit conversions. If you're performing operations that require very high precision, it's worth checking the results.
  3. Performance: When working with large datasets, UnitsNet conversion operations may need to be optimized. It's especially beneficial to run performance tests if unit conversions will be done inside large loops.

Conclusion

UnitsNet is a great solution for developers who want to perform unit conversions reliably and easily on the .NET platform. With its wide unit support, simple usage, and powerful conversion features, it provides convenience in scientific, engineering, and everyday applications. If you have unit conversion needs in your projects, I recommend trying UnitsNet.

See you in the next article...

Adding Custom Sounds to Notifications in Expo

· 3 min read
Ali Burhan Keskin
Software Developer

captionless image

Adding notifications to your mobile app with Expo is quite straightforward. Customizing these notifications with unique sounds is a great way to enhance the user experience. However, with Expo, especially on Android devices, some additional settings are necessary.

In this article, we’ll go over the step-by-step process for adding custom sounds to notifications in your Expo project.

Note: This guide assumes you have configured the expo-notifications package and the necessary permissions. Remember that custom notification sounds are only supported when using EAS Build. (See: "Custom notification sounds are only supported when using EAS Build.")

1. Adding Sound Files and Configuring app.config

First, add your sound file according to your project’s file structure. For example, you might place it at src/assets/sounds/bip.mp3. Then, specify this file path in your app.config file:

export default ({ config }: ConfigContext): ExpoConfig => ({
...config,
assetBundlePatterns: ["./src/assets/sounds/*"],
plugins: [ [ "expo-notifications",
{
sounds: ["./src/assets/sounds/bip.mp3"],
},
],
],
});

2. Configuring Notifications

Configuring notifications correctly is crucial. For Android, you need to create a new notification channel to send notifications with a custom sound. Notifications sent through this channel will play the specified sound. For iOS, you don’t need a separate channel; simply specify the sound file directly in the notification content.

Define the notification settings as follows:

Notifications.setNotificationHandler({
handleNotification: async () => ({
shouldShowAlert: true,
shouldPlaySound: true,
shouldSetBadge: true,
}),
});

Then, set up the configuration in App.js within a useEffect:

if (Platform.OS === "android") {
await Notifications.setNotificationChannelAsync("bip", {
name: "BipChannel",
importance: Notifications.AndroidImportance.MAX,
vibrationPattern: [0, 250, 250, 250],
sound: "bip.mp3",
});
}

3. Sending a Notification

Now that the configuration is ready, you can send notifications with a custom sound. Use the following function to send a test notification:

const handleTestNotification = async () => {
if (Platform.OS === "android") {
await Notifications.scheduleNotificationAsync({
content: {
title: "Test Notification",
sound: true,
},
trigger: {
seconds: 1,
channelId: "bip",
},
});
} else {
await Notifications.scheduleNotificationAsync({
content: {
title: "Test Notification",
sound: "bip.mp3",
},
trigger: {
seconds: 1,
},
});
}
};

Note: Remember to set sound: true and channelId: "bip" for Android, and sound: "bip.mp3" for iOS.

Using custom notification sounds in Expo is a powerful way to personalize the user experience of your mobile app. Although there are slight differences between Android and iOS, following these steps allows you to quickly add custom sounds to your project. This will give your app a unique touch and provide a more memorable experience for your users.

Try sending a test notification to see how custom notification sounds work in your projects!

Happy coding!

Resources

Expo Notifications Documentation

Apache Ignite

· 5 min read
Ahmet Buğra Kösen
Software Developer

As the need for database scaling and in-memory data processing increases, so does the search for a powerful tool that can meet these needs. Apache Ignite is an open-source, distributed in-memory data platform that provides a solution to this need. In this article, we'll explore Apache Ignite, look at its core features, and see how to integrate it with .NET Core through a sample project.

What is Apache Ignite?

Apache Ignite is a scalable and high-performance data platform that uses in-memory technologies for data storage and processing. Ignite not only stores data in memory but also offers distributed data processing, SQL and NoSQL data management, data grid, and much more. These features enable you to develop low-latency and high-performance applications.

Ignite is a widely preferred tool for solving database scaling issues or intensive data processing needs. It's an ideal platform especially for big data and real-time processing requirements.

Core Features of Apache Ignite

  • In-Memory Storage: Ignite provides high-speed access by storing your data in memory.
  • Distributed SQL: You can access data using SQL queries, even in a distributed environment.
  • Horizontal Scaling: Ignite can easily scale horizontally by adding nodes.
  • Low Latency: Since Ignite keeps data directly in memory, it offers millisecond-level latency.

.NET Core Integration with Apache Ignite

Apache Ignite, with its .NET Core support, allows you to use in-memory data storage and distributed data processing capabilities in your .NET applications. Let's see how we can use Ignite with .NET Core.

Step 1: Adding the Ignite Library to Your Project

First, we'll start by installing the required NuGet package for Ignite's .NET Core support. You can install this package using the following command:

Install-Package Apache.Ignite

Step 2: Starting the Ignite Server

We'll create a simple console application to start the Ignite server. The Ignite server is the main component we'll use to store data and perform distributed processing. The following code snippet shows an example you can use to start the Ignite server:

using Apache.Ignite;
using Apache.Ignite.Core.Cache.Configuration;
using System;

namespace IgniteDotNetExample
{
class Program
{
static void Main(string[] args)
{
var igniteConfiguration = new IgniteConfiguration
{
IgniteInstanceName = "myIgniteInstance",
WorkDirectory = "./igniteWorkDir",
ClientMode = false // Running as a server node.
};

IIgnite ignite = Ignition.Start(igniteConfiguration);

Console.WriteLine("Ignite server started.");

// Let's create a sample cache.
var cacheConfiguration = new CacheConfiguration
{
Name = "sampleCache",
CacheMode = CacheMode.Partitioned,
AtomicityMode = CacheAtomicityMode.Transactional
};

var cache = ignite.GetOrCreateCache<int, string>(cacheConfiguration);

// Let's add data to the cache.
cache.Put(1, "Hello Ignite!");
string value = cache.Get(1);

Console.WriteLine($"Data in cache: {value}");

Console.ReadLine();
}
}
}

In the code above, the Ignite server is started and a cache named sampleCache is created. This cache will be used to store our data in memory.

Step 3: Two Ignite Instances and Persistent Storage Structure

Let's prepare an example showing how Apache Ignite works with two instances and how to enable persistent storage. In this example, we'll start two Ignite nodes and configure persistent storage to save data on disk.

using Apache.Ignite.Core;
using Apache.Ignite.Core.Cache.Configuration;
using Apache.Ignite.Core.Configuration;
using System;

namespace IgnitePersistentExample
{
class Program
{
static void Main(string[] args)
{
// Starting the first Ignite instance
var igniteConfig1 = new IgniteConfiguration
{
IgniteInstanceName = "igniteInstance1",
WorkDirectory = "./igniteWorkDir1",
DataStorageConfiguration = new DataStorageConfiguration
{
DefaultDataRegionConfiguration = new DataRegionConfiguration
{
Name = "Default_Region",
PersistenceEnabled = true // Persistent storage enabled.
}
}
};

IIgnite ignite1 = Ignition.Start(igniteConfig1);
ignite1.GetCluster().Active(true);
Console.WriteLine("Ignite Instance 1 started.");

// Starting the second Ignite instance
var igniteConfig2 = new IgniteConfiguration
{
IgniteInstanceName = "igniteInstance2",
WorkDirectory = "./igniteWorkDir2",
DataStorageConfiguration = new DataStorageConfiguration
{
DefaultDataRegionConfiguration = new DataRegionConfiguration
{
Name = "Default_Region",
PersistenceEnabled = true // Persistent storage enabled.
}
}
};

IIgnite ignite2 = Ignition.Start(igniteConfig2);
ignite2.GetCluster().Active(true);
Console.WriteLine("Ignite Instance 2 started.");

// Creating cache and adding data
var cacheConfiguration = new CacheConfiguration
{
Name = "persistentCache",
CacheMode = CacheMode.Partitioned,
AtomicityMode = CacheAtomicityMode.Transactional
};

var cache = ignite1.GetOrCreateCache<int, string>(cacheConfiguration);
cache.Put(1, "Persistent Hello Ignite!");
string value = cache.Get(1);

Console.WriteLine($"Data in Persistent Cache: {value}");

Console.ReadLine();
}
}
}

In the code above, two different Ignite instances are started with persistent storage configuration enabled. This way, even if the Ignite servers are restarted, the data will be saved on disk and won't be lost.

Step 4: Accessing Data with Ignite

One of Ignite's most powerful features is SQL support. You can process data stored on Ignite using SQL queries. For example, it's possible to store a user table on Ignite and access the data in this table using SQL queries:

[Serializable]
public class User
{
[QuerySqlField(IsIndexed = true)]
public int Id { get; set; }

[QuerySqlField]
public string Name { get; set; }
}

class Program
{
static void Main(string[] args)
{
IIgnite ignite = Ignition.Start();

var cache = ignite.GetOrCreateCache<int, User>(new CacheConfiguration("userCache", typeof(User)));

// Let's add users.
cache.Put(1, new User { Id = 1, Name = "Ali" });
cache.Put(2, new User { Id = 2, Name = "Ayse" });

// Let's fetch users with an SQL query.
var query = new SqlFieldsQuery("SELECT Id, Name FROM User WHERE Name = ?", "Ali");
var cursor = cache.Query(query);

foreach (var row in cursor)
{
Console.WriteLine($"User: Id={row[0]}, Name={row[1]}");
}

Console.ReadLine();
}
}

In the example above, we created a class named User and stored it in a cache named userCache. Then, we accessed the data stored in this cache using SQL queries.

Conclusion

Apache Ignite is a powerful platform that offers scalable and high-performance in-memory data management and processing solutions. By storing data in memory and providing distributed SQL support, Ignite can help accelerate your .NET applications and increase their efficiency. In this article, we covered the core features of Apache Ignite and how it can be integrated with .NET Core through examples. We also learned how to set up a structure working with persistent storage features using two Ignite instances.

To discover other powerful features that Ignite offers and learn more, you can check out the official Apache Ignite documentation.

Comments and Contributions

Feel free to comment to share your experiences or ask questions about Apache Ignite and .NET Core. For those who want to learn more about developing real-time data processing applications with Apache Ignite, Ignite's powerful features are truly worth exploring.

Mutation Testing

· 5 min read
Ahmet Buğra Kösen
Software Developer

x.png

In software development, unit tests are an indispensable tool for improving code quality and reliability. But how can we tell if our unit tests are truly effective? This is where Mutation Testing comes into play. In this article, we'll explore the concept of Mutation Testing, how it can be applied manually, and how to automate it using Stryker.NET, a popular tool in the .NET ecosystem.


What is Mutation Testing?

Mutation Testing is a technique used to evaluate the effectiveness of your tests. In this method, small changes (mutations) are made to your code to check whether your tests can catch these changes. If your tests fail to detect these mutations, it indicates that your test scenarios need improvement.

Why is it Important?

  • Improves Test Quality: It measures not just whether code is tested, but how effective the tests actually are.
  • Enhances Bug Detection: It helps identify potential bugs at an early stage.
  • Ensures Reliability: It shows how resilient your code is against changes.

How to Perform Mutation Testing Manually?

You can apply mutation testing principles without using automated tools. In this section, we'll demonstrate how to perform mutation testing manually with a simple example.

First, let's write a simple class and its corresponding unit tests.

MathOperations.cs:

namespace MutationDemo;

public class MathOperations
{
public int Add(int a, int b) => a + b;
}

Unit Test:

using Xunit;
using FluentAssertions;

namespace MutationDemo.UnitTests;

public class MathOperationsTests
{
[Fact]
public void Add_ShouldReturnCorrectSum()
{
// Arrange
var mathOperations = new MathOperations();

// Act
var result = mathOperations.Add(2, 3);

// Assert
result.Should().Be(5);
}
}

When we run the test using the dotnet test command in the test project directory, we'll see that our test passes successfully:

Passed!  - Failed:     0, Passed:     1, Skipped:     0, Total:     1, Duration: < 1 ms

Now, let's create a mutation by intentionally introducing a bug in our code. For example, let's replace the + operator with the - operator:

public int Add(int a, int b) => a - b;

After saving the changes, run the test again using dotnet test. The test output should be as follows:

Failed!  - Failed:     1, Passed:     0, Skipped:     0, Total:     1, Duration: < 1 m

The test failure indicates that our test caught this mutation. We've written a great unit test—our test can detect this bug in the code.


You can also try other possible mutations. For example, we can change return a + b; to return a;:

public int Add(int a, int b) => a;

When you run the tests again, the test should still fail. If the tests pass, it indicates that your tests are not comprehensive enough and you need to review them.


What is Stryker.NET?

While mutation testing can be done manually for small projects, it can be time-consuming and complex for larger projects. This is where Stryker.NET comes in. Stryker.NET is an open-source mutation testing tool developed for the .NET platform. It automatically creates mutations in your code and analyzes whether your tests can catch them.

Features

  • Easy Integration: Can be quickly integrated into your existing .NET projects.
  • Flexible Configuration: Compatible with different test frameworks (xUnit, NUnit, MSTest).
  • Detailed Reporting: Provides detailed reports including mutation scores and which mutations were not detected.

Mutation Testing with Stryker.NET

Let's automate the mutation test we performed manually earlier using Stryker.NET on the same project.

Requirements

  • .NET 6 or newer

  • xUnit for unit tests

  • Stryker.NET installed

    To install Stryker.NET as a global tool, run the following command in the terminal:

    dotnet tool install -g dotnet-stryker

Running Mutation Testing with Stryker.NET

Run the following command in your test project directory:

dotnet stryker

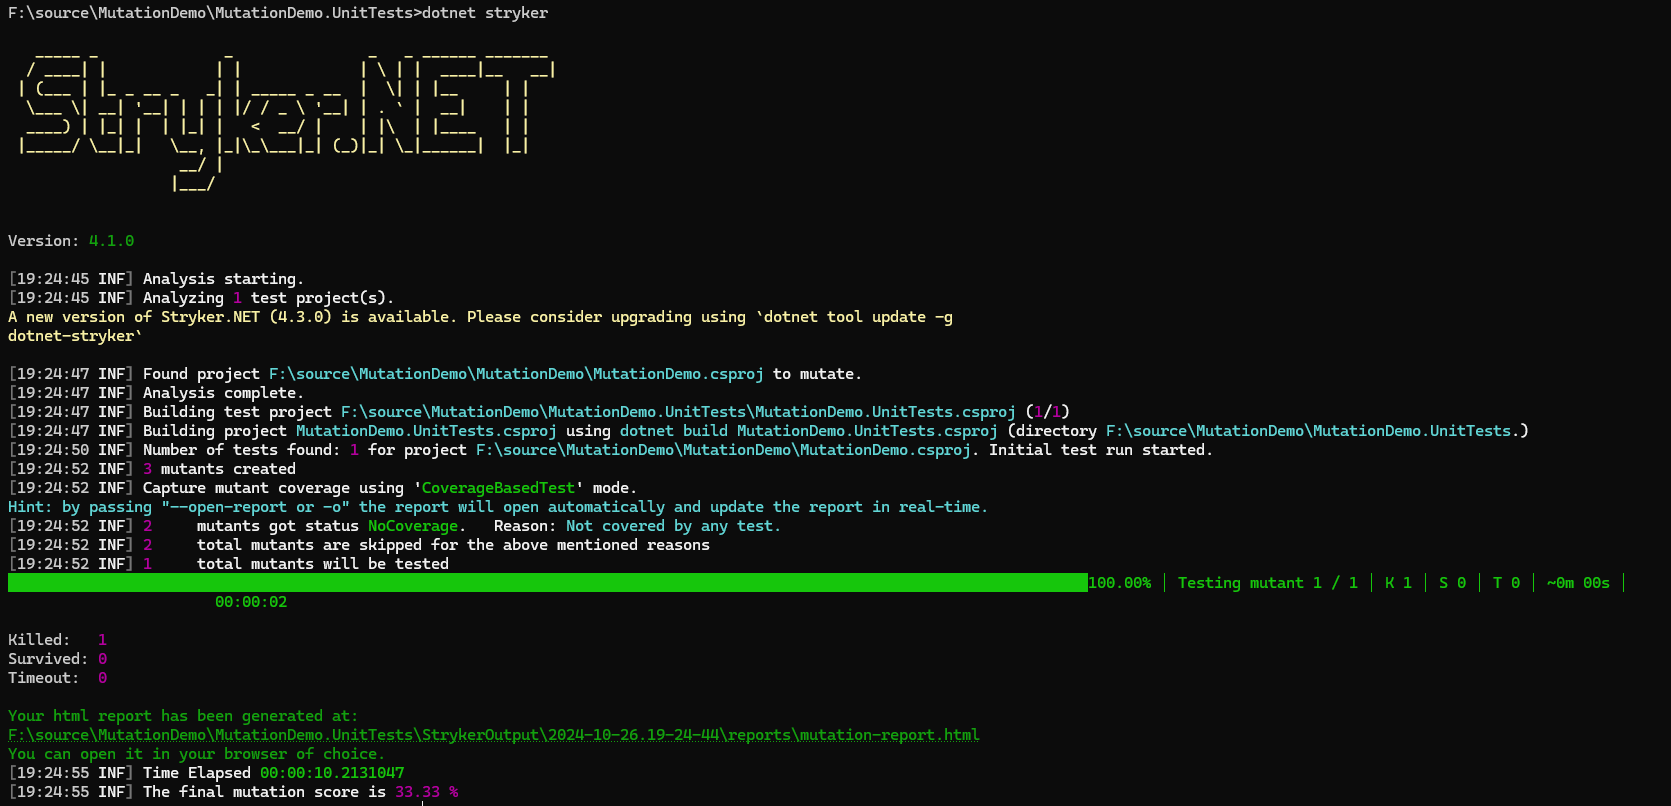
This command starts mutation testing with Stryker.NET's default settings. After the tests are completed, Stryker.NET will provide you with a report.

image.png

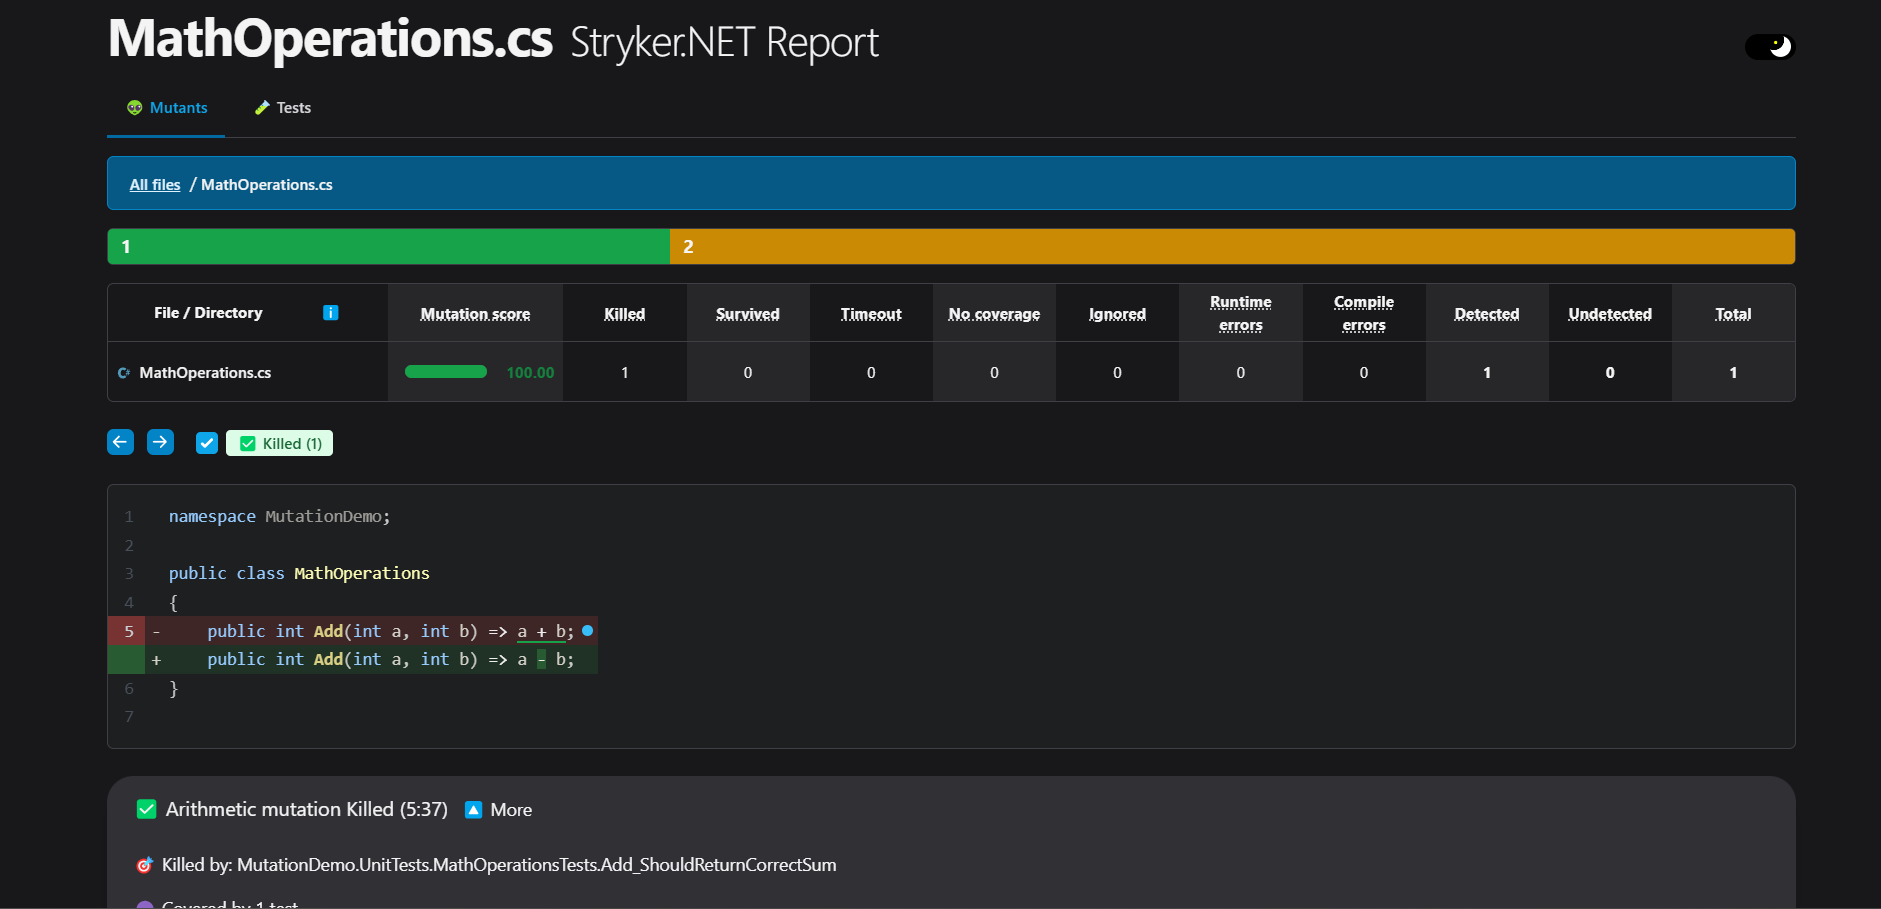
When we examine the html report generated by Stryker, we can see how many mutations Stryker created and in which parts of the code:

image.png

We can see that the mutation score is 100%. This means we've written our tests to cover the changes made to the Add method.

Stryker.NET provides detailed reports on which mutations were killed (caught by tests) and which survived (not caught by tests). By examining these reports, you can identify which scenarios are missing from your tests.


Conclusion

Mutation Testing is a powerful method for understanding whether your unit tests are truly effective. While it can be applied manually, tools like Stryker.NET can automate this process, saving you time and effort. This way, you can improve your code quality and detect potential bugs at an early stage.

Side Note: I can't describe the disappointment I felt when I saw a mutation score of only 40% in my beloved library that contains nearly 2000 tests that I wrote with great effort 😟 If you don't want to experience the same disappointment, you can improve your test writing techniques by examining mutation reports.

See you in the next article…

Source Control Standards

· 11 min read
Ahmet Buğra Kösen
Software Developer

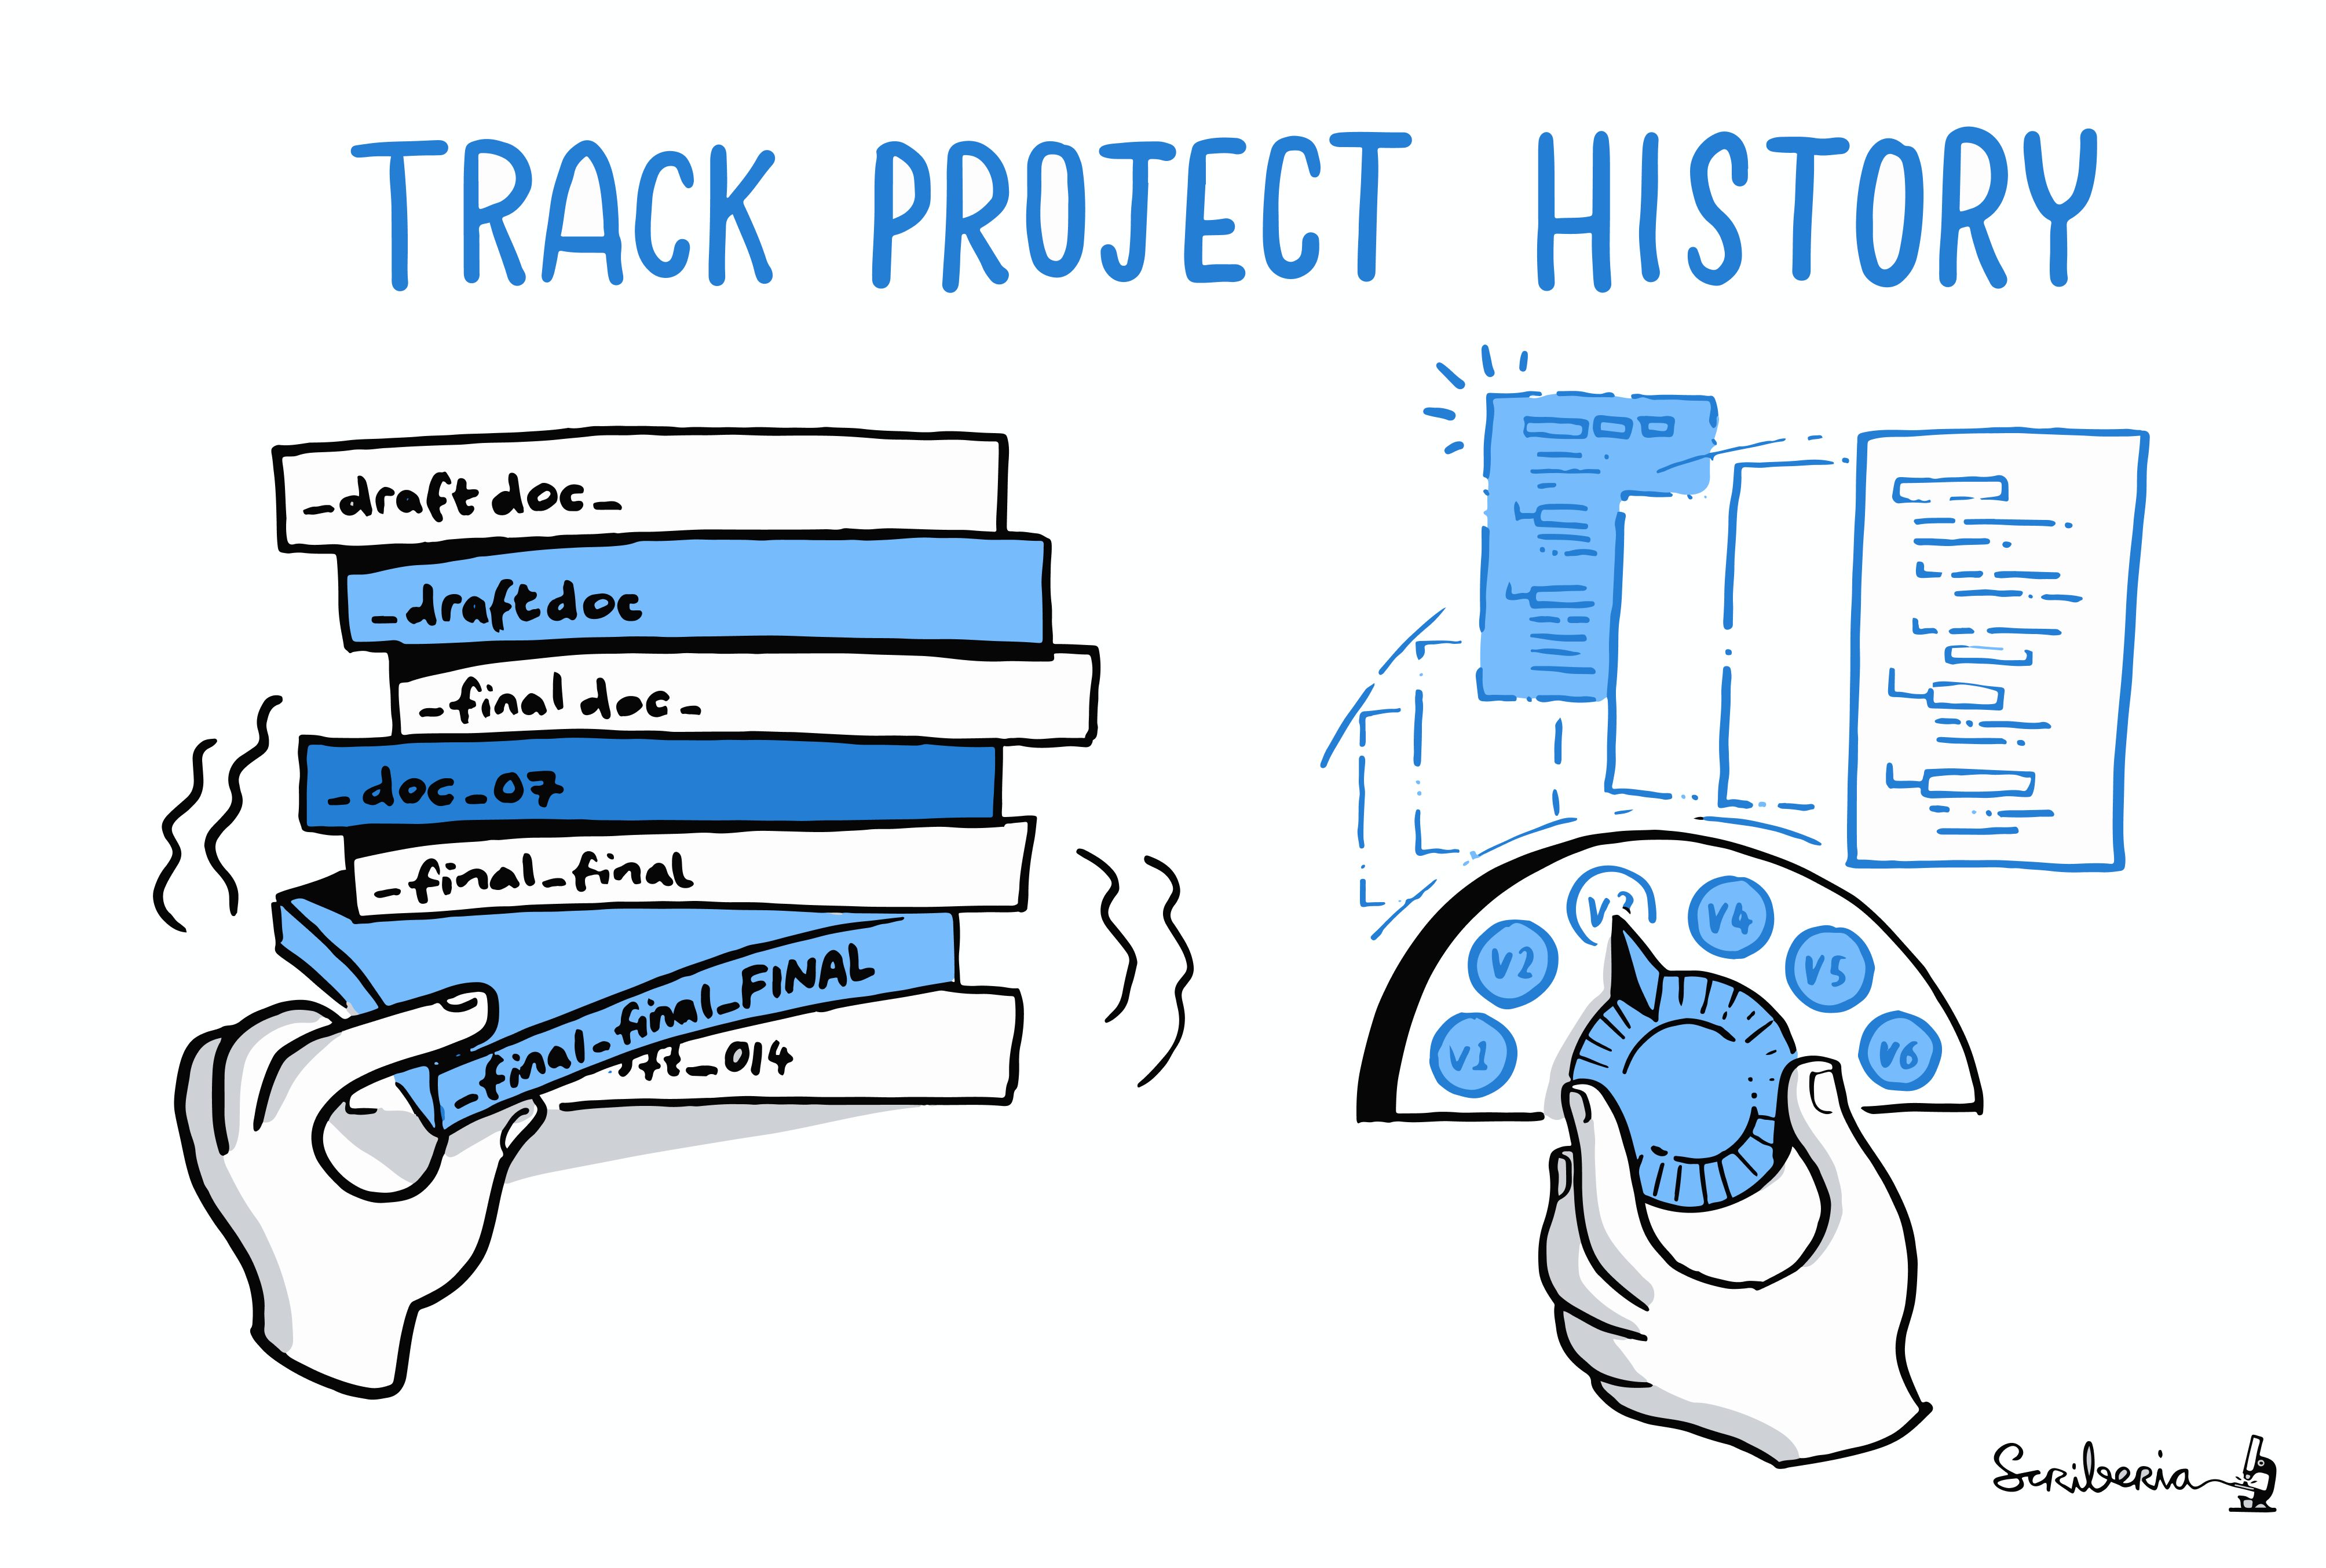
project-history 1.png

As teams grow, implementing certain standards becomes mandatory. Otherwise, managing projects or source code and maintaining the efficiency of the working environment becomes difficult.

Now that we've given a general answer to questions like "why are we doing this?" or "isn't this a waste of time among all the work?" for the standards we're about to discuss, let's take a look at what we'll cover in this document;

  • Semantic Versioning
  • Perfect Commit;
    • Perfect Commit Messages
    • Conventional Commits
  • Branch Naming

Semantic Versioning (SemVer)

If you're wondering why there's a section about versioning in a document called Source Control Standards, be patient and keep reading 😉

What is Semantic Versioning?

Semantic versioning is a standard way to determine version numbers in software projects. This standard ensures that version numbers are meaningful and predictable. Semantic versioning is typically used in the MAJOR.MINOR.PATCH format.

Let's take a look at what each section means and when it should be incremented:

  1. MAJOR: Incremented when backward-incompatible changes are made.
  2. MINOR: Incremented when backward-compatible new features are added.
  3. PATCH: Incremented when backward-compatible bug fixes are made.

Frame 1.png

Why Should You Use Semantic Versioning?

  • Understandability: You can easily understand how much the software has changed and what kind of effects these changes have on compatibility from the version number.
  • Reliability: Users of the software can better assess the risks of updates by looking at the version number.
  • Collaboration: When team members and users know the meaning of version numbers, they feel more confident about contributing to the project and using the software.

How to Do Semantic Versioning?

Let's assume we're developing an API for an e-commerce site as a team. Below are scenarios and how the version number would change in these scenarios:

  • You're adding basic features to the API and it's not yet suitable for users, meaning you don't have a stable version. In this case, the first version number should be 0.1.0.
  • You added the endpoints necessary for users to log in. In this case, the next version number should be 0.2.0.
  • You noticed there were bugs in the newly added endpoints and released a version fixing them. In this case, the version number should be 0.2.1.
  • You completed the basic features of the API and it's now ready for users. In this case, your first version number should be 1.0.0.
    • Releasing a stable version also means delivering the final trial version. So version numbers 0.2.1 and 1.0.0 can actually be the same. In this case, backward incompatibility is not expected. Backward incompatibilities usually appear in versions after 1.0.0.
  • You added certain features to your API and the current version number is 1.17.4. To improve API performance and fix security vulnerabilities, you updated the framework and packages you use, and consequently made backward-incompatible changes to the API. In this case, your next version number should be 2.0.0.
  • Your business unit asked you to add a new payment infrastructure. In this case, your new version number should be 2.1.0

Now that we've semantically versioned our imaginary e-commerce site, CONCLUSION;

Semantic versioning is a standard for keeping your project organized and understandable. At every stage of the project, we can provide clearer information about the project's status to users and team members by correctly updating version numbers. Using this standard, we can make the software development process more manageable and reliable.

For rules you should follow when applying Semantic Versioning and more information, you can check out the SemVer Official Website.


Perfect Commit Messages

Untitled

Although they may seem unimportant, commit messages are an important part of the software development process. A well-written commit message helps both you and your team members understand the project better. It eliminates questions like "Who made this change and why?" and provides significant time savings, especially for team members who constantly work on different projects.

Writing the perfect commit message is only half the job; breaking changes into parts and planning what should be added to these parts is equally important. Commits can play an important role in how you approach a task. Logically grouping changes into commits also allows you to improve the software development process by planning a task and breaking it into smaller pieces.

This will make you think more about the task and the solution you're producing, not just at the beginning but also when breaking changes into commits and writing the commit message. This can help you review your implementation and perhaps notice overlooked edge cases, missing tests, or anything else you might have forgotten.

How?

Now that we've left the task of properly breaking our development into commits to you, let's answer the question of how we should write the commit message. Consistency is very important here, so teams should first discuss and agree on the following three topics;

  • Style: Plays an important role in making the commit history readable. Includes topics such as grammar, punctuation, capitalization, and line lengths.
  • Content: Standardizing content is not easy. However, it should include information about why the changes were made and how they were implemented, and when necessary, the technical details and effects of the changes.
  • Metadata: Should include additional information such as Issue Tracking IDs, notes indicating whether changes have been tested, or findings or comments obtained during the code review process if necessary.

There's no single way to address these three topics, so it's open to discussion, but most Git commit messages follow a certain pattern. We'll examine this commonly used pattern below.

Template

[subject]

[optional body]

[optional footer(s)]

Subject

Just like in an email, the subject is a very important part. It's usually the first, perhaps the only part people will read, so it should be visually appealing and easy to understand, avoiding unnecessary capitalization and punctuation, and using the right keywords.

The imperative mood is standard; when Git creates a commit on your behalf (for example, when you run git merge or git revert), it uses the imperative mood. This means you should write "Add" instead of "Added" or "Adds". The text in the subject should complete this sentence: "If applied, this commit...". Most teams apply the following rules for commit subjects;

  • Should start with a capital letter
  • Should not end with a period
  • Should be 50 characters or less

Example of a good commit subject: Update configuration files with new staging URL

Again, these rules are not strict rules like "you can't do this, you'll turn to stone if you do". You can even add emojis to your commit messages if you want 😊

Body

The subject is often self-explanatory, but sometimes it's necessary to add more information to the "body" field. We use this field to provide more context about WHAT and WHY changed.

Most teams apply the following rules for commit body;

  • Use a blank line to separate from the subject
  • Organize paragraphs with blank lines or bullet lists etc.
  • Line length should be 72 characters or less

Tim Pope's example can be shown as an example of the goal we should aim for in terms of style:

Short(50 chars or less) summary of changes

More detailed explanatory text, if necessary. Wrap it to 72 characters.
The blank line separating the summary from the body is critical (unless
you omit the body entirely); tools like rebase can get confused if you run
the two together.

Further paragraphs come after blank lines. Bullet points are okay, too.

- Use a hyphen or asterisk for bullet points.
- Capitalize the first letter of each point.

Metadata/Footer

We can add Azure DevOps tasks or user stories, Pull Requests, or Jira tickets related to the commit to the footer. This field is also where deprecated features and backward-incompatible changes should be indicated. Example;

BREAKING CHANGE: <summary>
<blank line>
Fixes #<user story>
Closes #<pr>

When we put it all together, our commits should look like the example below;

Add user authentication feature

- Implemented user authentication using JWT tokens for secure login.
- Added user registration functionality with password hashing for security.

Fixes #123
Closes #456
Not Tested

Conventional Commits

Untitled

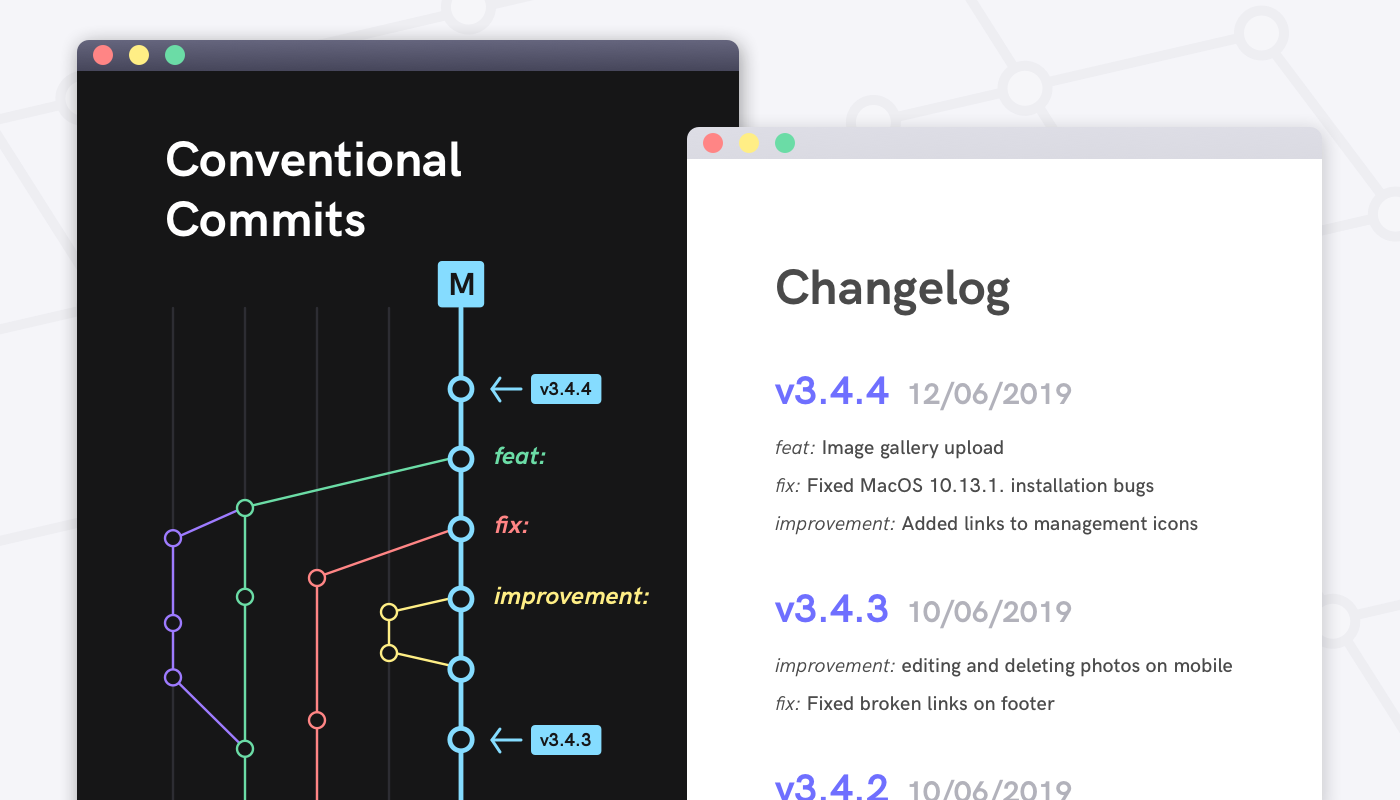
On top of the perfect commit we created in the previous section, we're trying to create a roof over the commit message by applying the standards set in the Conventional Commit specification, so we can get a meaningful commit history, obtain various reports from this history, and gain certain capabilities. In other words, we'll make our human-readable commit messages human & machine-readable. Also, this specification is compatible with Semantic Versioning.

Template

<type>[optional scope]: <subject>

[optional body]

[optional footer(s)]

A Conventional Commit must contain the following structural elements;

  1. fix: A commit of type fix fixes a bug in your code (parallel to PATCH in semantic versioning).
  2. feat: A commit of type feat adds a new feature to your code (parallel to MINOR in semantic versioning).
  3. BREAKING CHANGE: A commit with a footer starting with BREAKING CHANGE: or with a ! added after type/scope introduces a backward-incompatible change (parallel to MAJOR in semantic versioning).

Other commonly used types:

  1. docs: Documentation only changes
  2. style: Changes that don't affect the meaning of the code
  3. refactor: Code change that neither fixes a bug nor adds a feature
  4. perf: Performance improvements
  5. test: Adding missing tests or correcting existing tests
  6. build: Changes that affect the build system or external dependencies
  7. ci: Changes to CI configuration files and scripts
  8. chore: Other changes that don't modify src or test files
  9. revert: Reverts a previous commit

Examples

A commit message with subject and breaking change footer:

feat: allow provided config object to extend other configs

BREAKING CHANGE: `extends` key in config file is now used for extending other config files

A commit message with ! to draw attention to breaking change:

feat!: send an email to the customer when a product is shipped

A commit message with scope:

feat(api)!: send an email to the customer when a product is shipped

A commit message without body:

docs: correct spelling of CHANGELOG

For remaining details, check out the Conventional Commits Specification.

Benefits of using Conventional Commits:

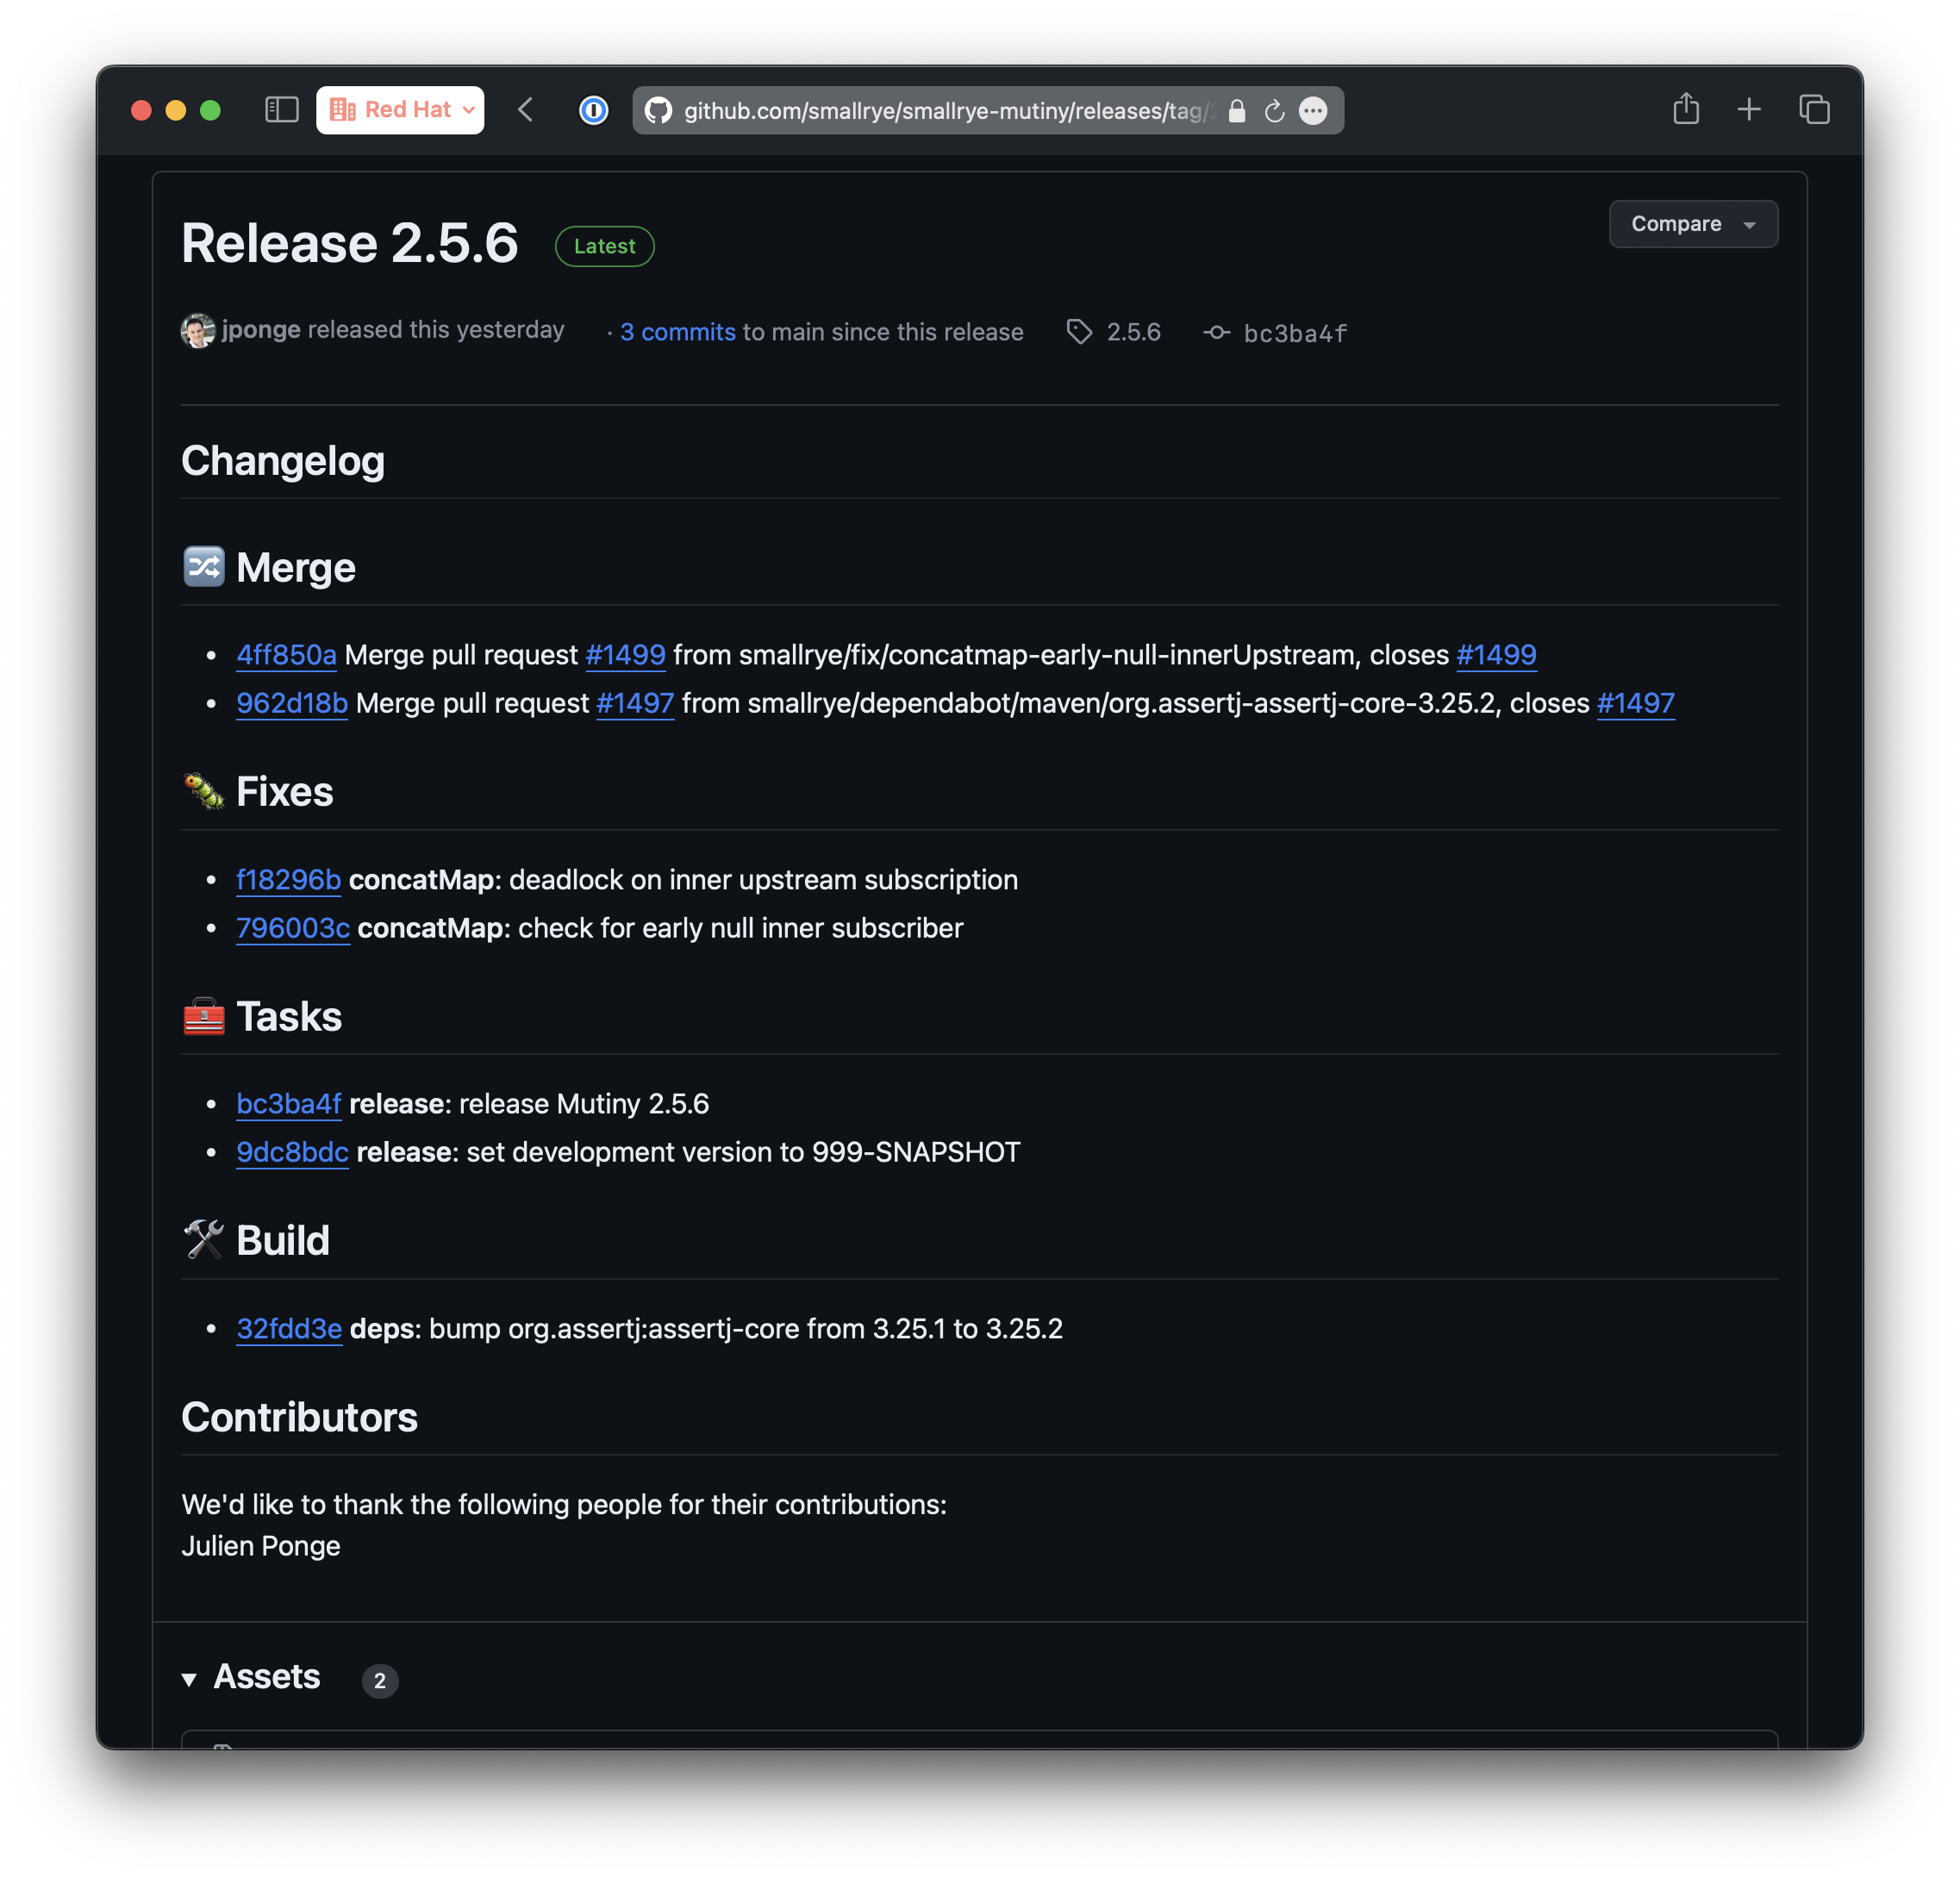
  • Automatically generating CHANGELOGs
  • Automatically determining semantic version bumps
  • Communicating the nature of changes to teammates and stakeholders
  • Triggering build and publish processes
  • Making it easier for people to contribute to your projects

Untitled


Branch Naming

Frame 2.png

Before making changes to the code base, we all create a branch. Managing these branches can become difficult in some cases. To prevent this, effectively naming and organizing branches can increase the efficiency of the development process.

Regular Branches

Regular branches in Git are long-lived branches:

  • Master (master/main) Branch: The default production branch
  • Development (dev) Branch: Main development branch for integrating features
  • QA (QA/test) Branch: Branch containing code ready for QA testing

Style

  • Lowercase and hyphens: Use lowercase letters and hyphens to separate words. Example: feature/new-login
  • Alphanumeric characters only: Only use alphanumeric characters (a-z, 0–9) and hyphens
  • Avoid consecutive hyphens: feature--new-login is confusing
  • Don't end with hyphen: feature-new-login- is incorrect
  • Be descriptive: The naming should reflect the work done in the branch

Branch Prefixes

  • feature/: New features. Example: feature/login-system
  • bugfix/: Bug fixes. Example: bugfix/header-styling
  • hotfix/: Critical production fixes. Example: hotfix/critical-security-issue
  • release/: Release preparation. Example: release/v1.0.1
  • docs/: Documentation changes. Example: docs/api-endpoints
  • experimental/: Experimental features. Example: experimental/new-algorithm
  • wip/: Work in progress. Example: wip/refactor-auth-system

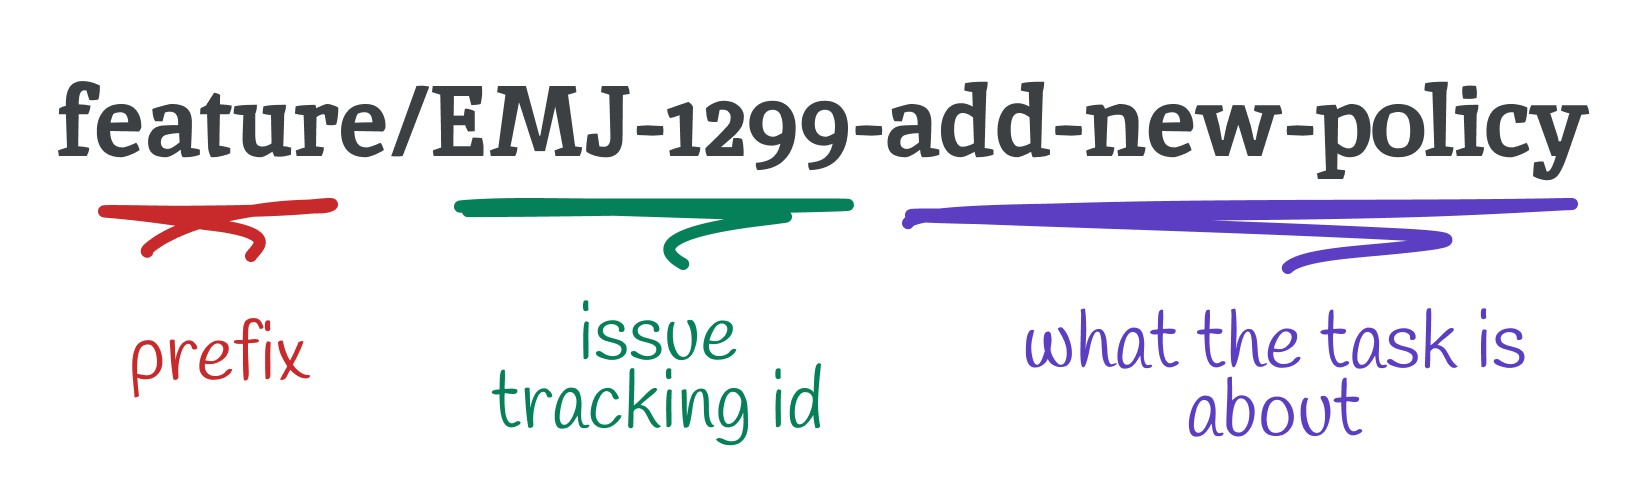
Including ticket numbers from project management tools is common:

  • bugfix/EMJ-1789-fix-header-styling
  • feature/US-1288-new-login-system
  • feature/T-1289-new-login-system

Whether to apply these standards or postpone them is up to you. However, we shouldn't forget LeBlanc's law that Robert C. Martin refers to in Clean Code: "Later equals never." 🙂


Sources: