Milvaion UI Screenshots
This page provides a visual tour of the Milvaion Dashboard, showcasing its key features and interfaces.
All screenshots on this page are captured in dark mode. The dashboard also supports light mode.
Overview
The main dashboard provides a comprehensive view of your job scheduling system at a glance.
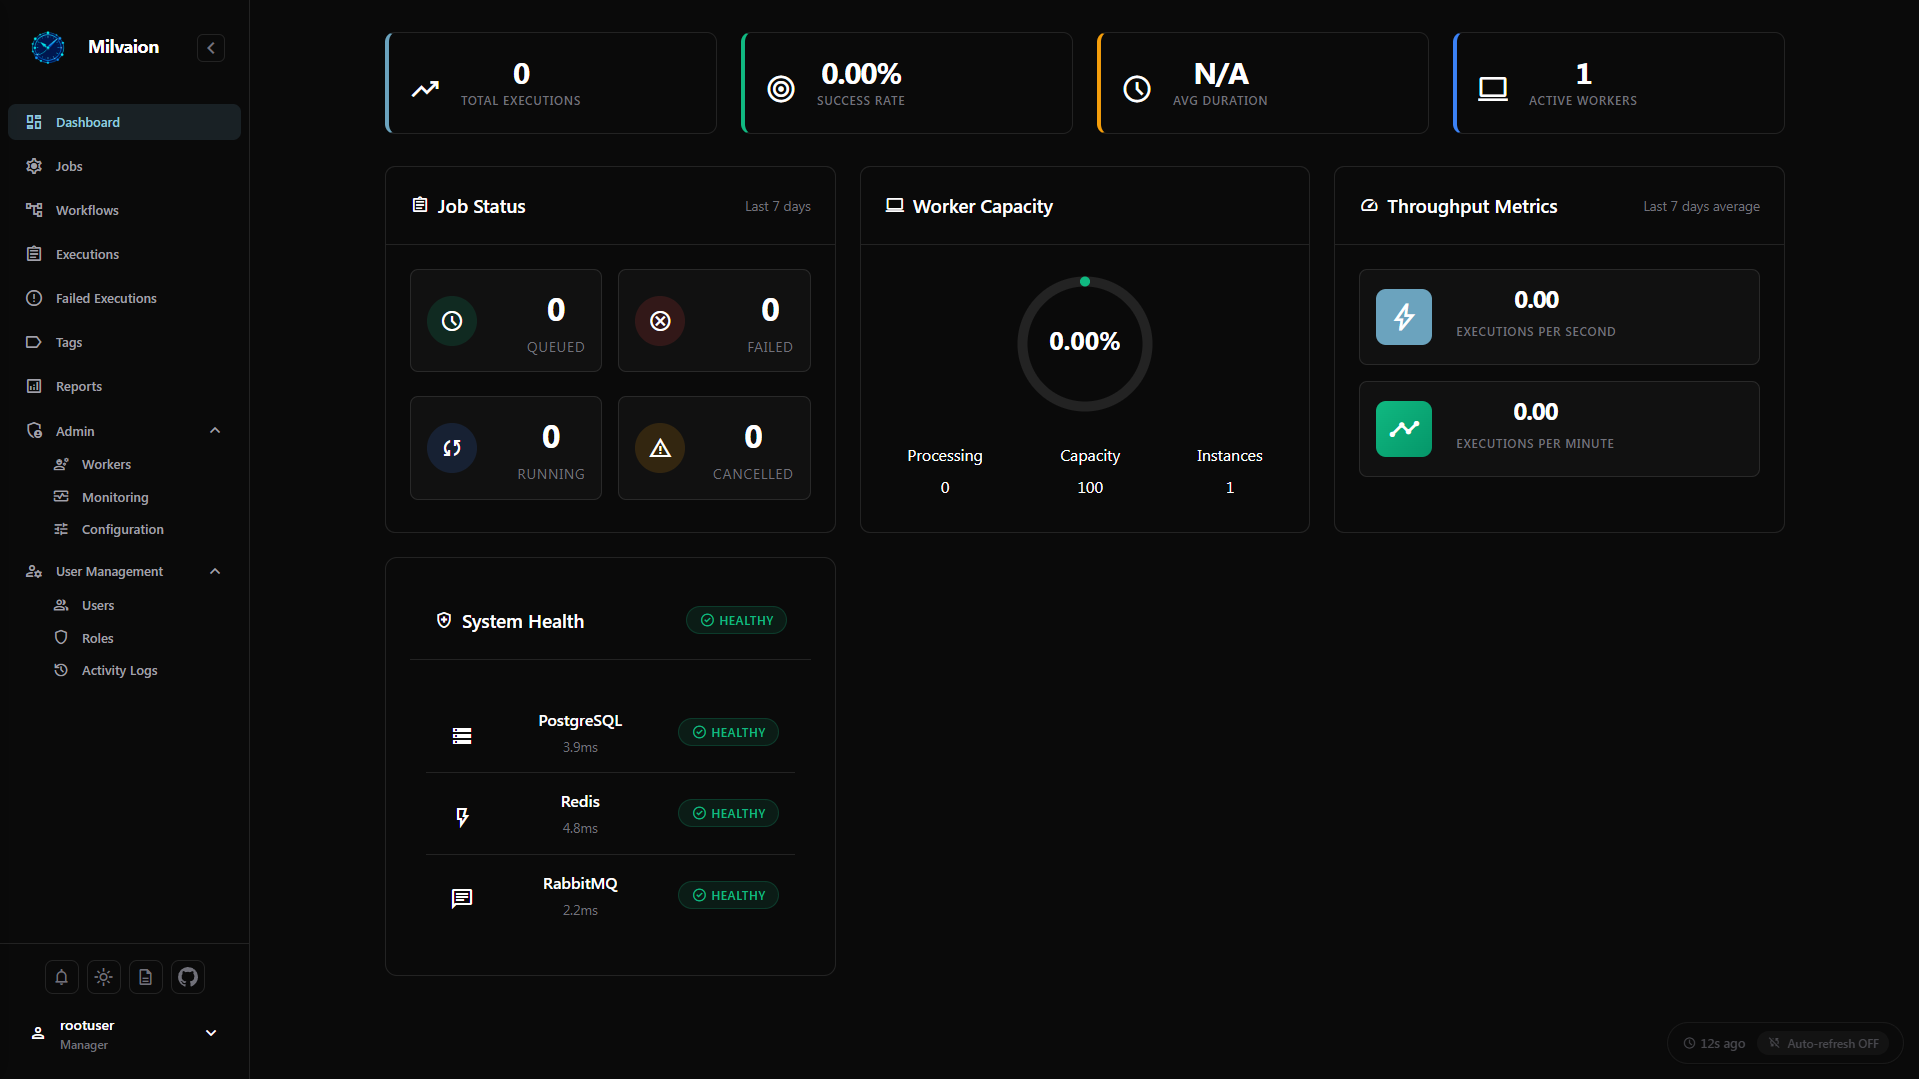
Key elements:
- Total executions and success rate
- Active workers and capacity utilization
- Queued, running, and completed jobs
- Executions per minute metrics
- System health
Jobs Management
Job List View
Browse all scheduled jobs with filtering capabilities.
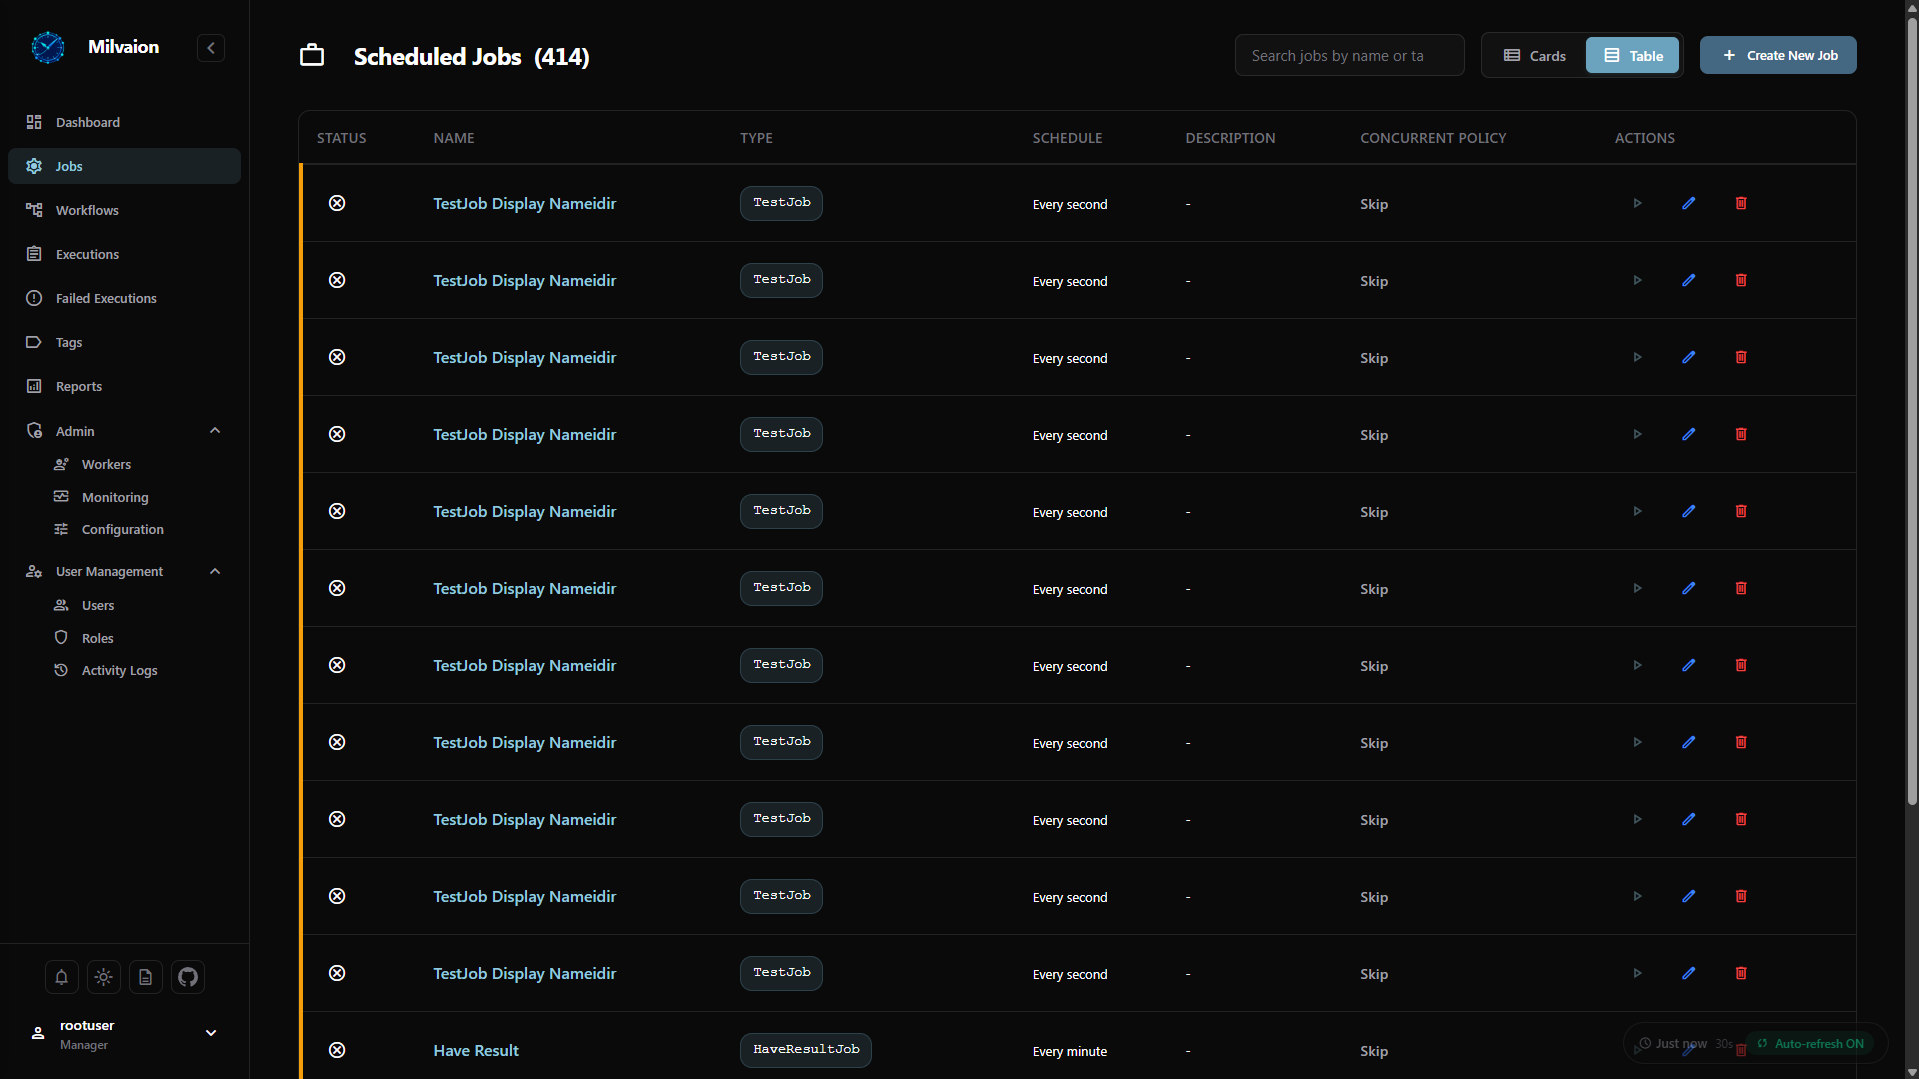
Features:
- Search by job name or tag
- Card and table views
- Quick actions (Enable/Disable, Trigger, Edit, Delete)
Filters:
| Filter | Values |
|---|---|
| Status | Active / Inactive |
| Type | Any job type registered by a worker |
| Schedule | Recurring / One-time |
| Worker | Any registered worker |
| Source | Milvaion / External (Quartz, Hangfire) |
Filters combine, and the active count appears next to a Clear filters button. The Type and Worker lists are built from the worker registry rather than from the jobs currently on screen, so an option does not disappear the moment you select it.
A one-time job that has already run keeps its Active badge and gains a Completed badge - it is not disabled, it simply has nothing left to do. See Core Concepts.
Job Details
View comprehensive information about a specific job.
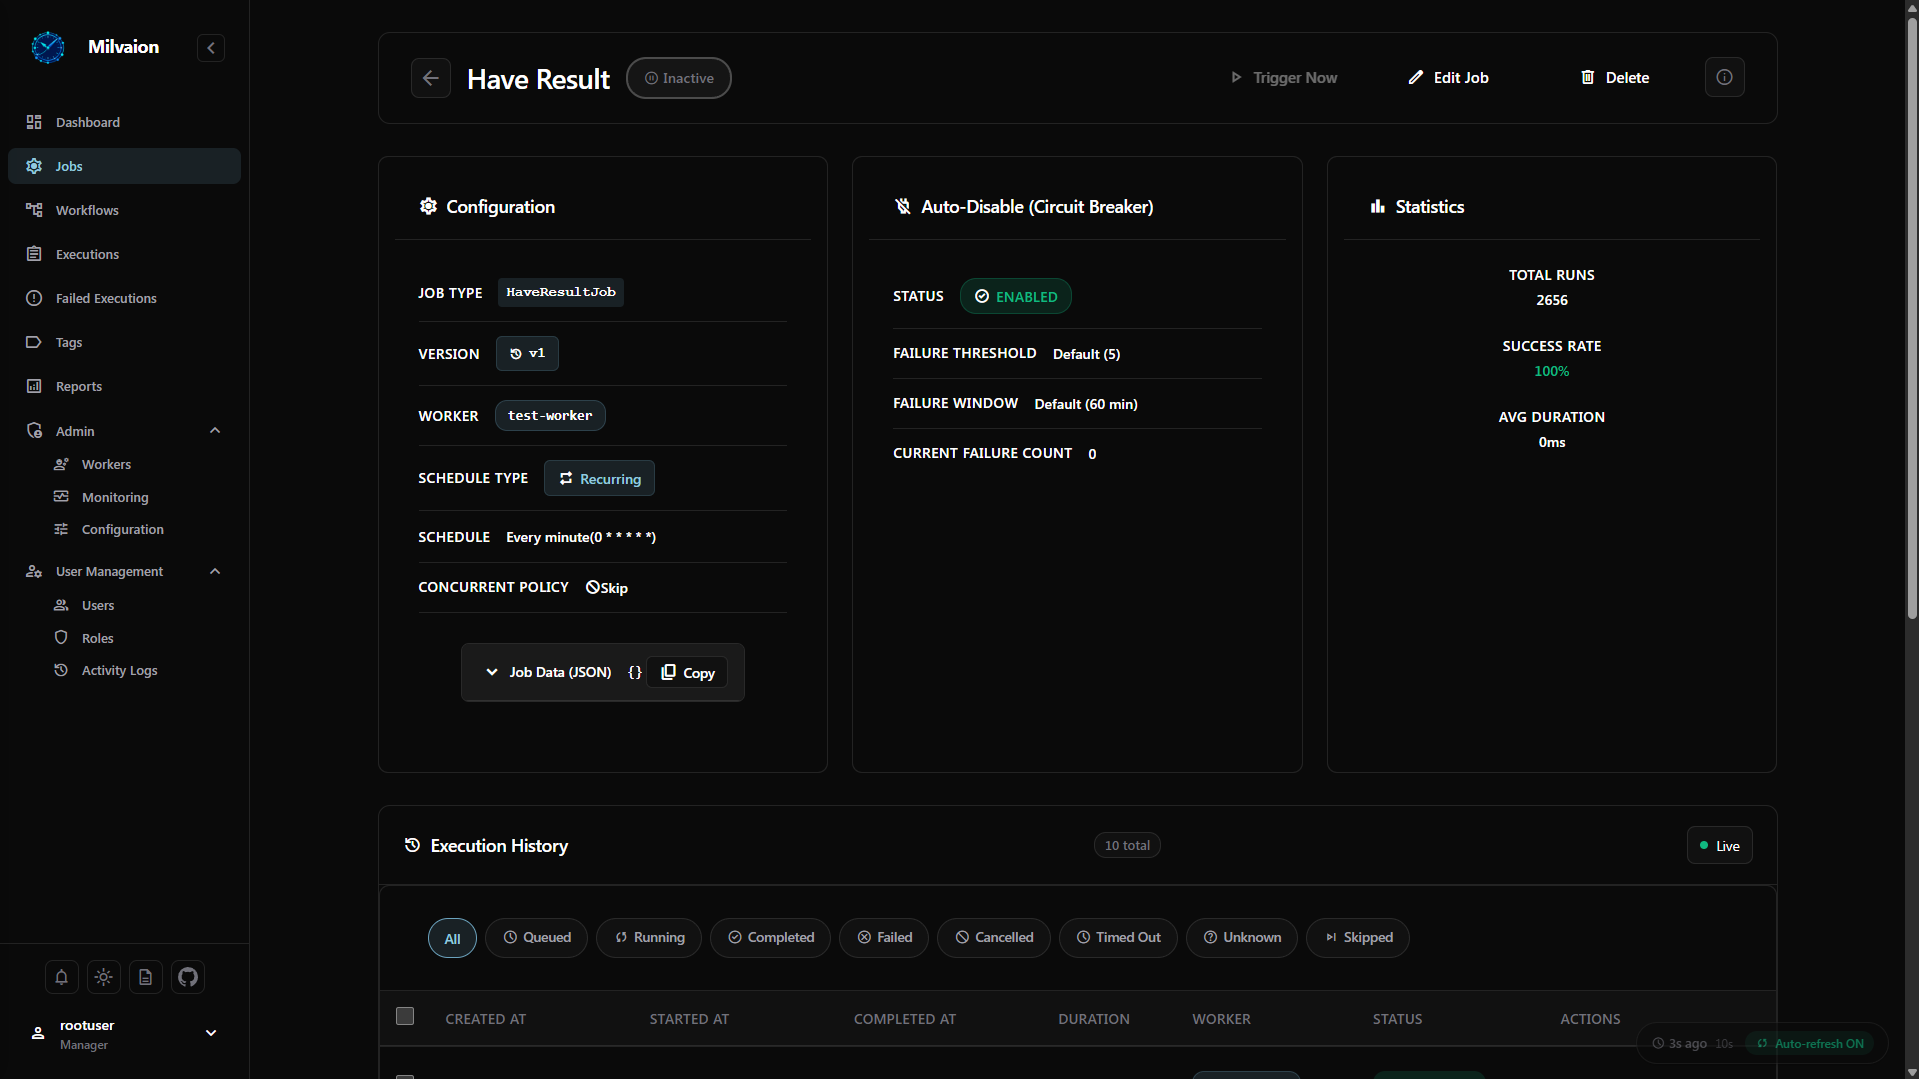
Information displayed:
- Job configuration (cron expression, timeout, retries)
- Execution history
- Recent occurrences with status
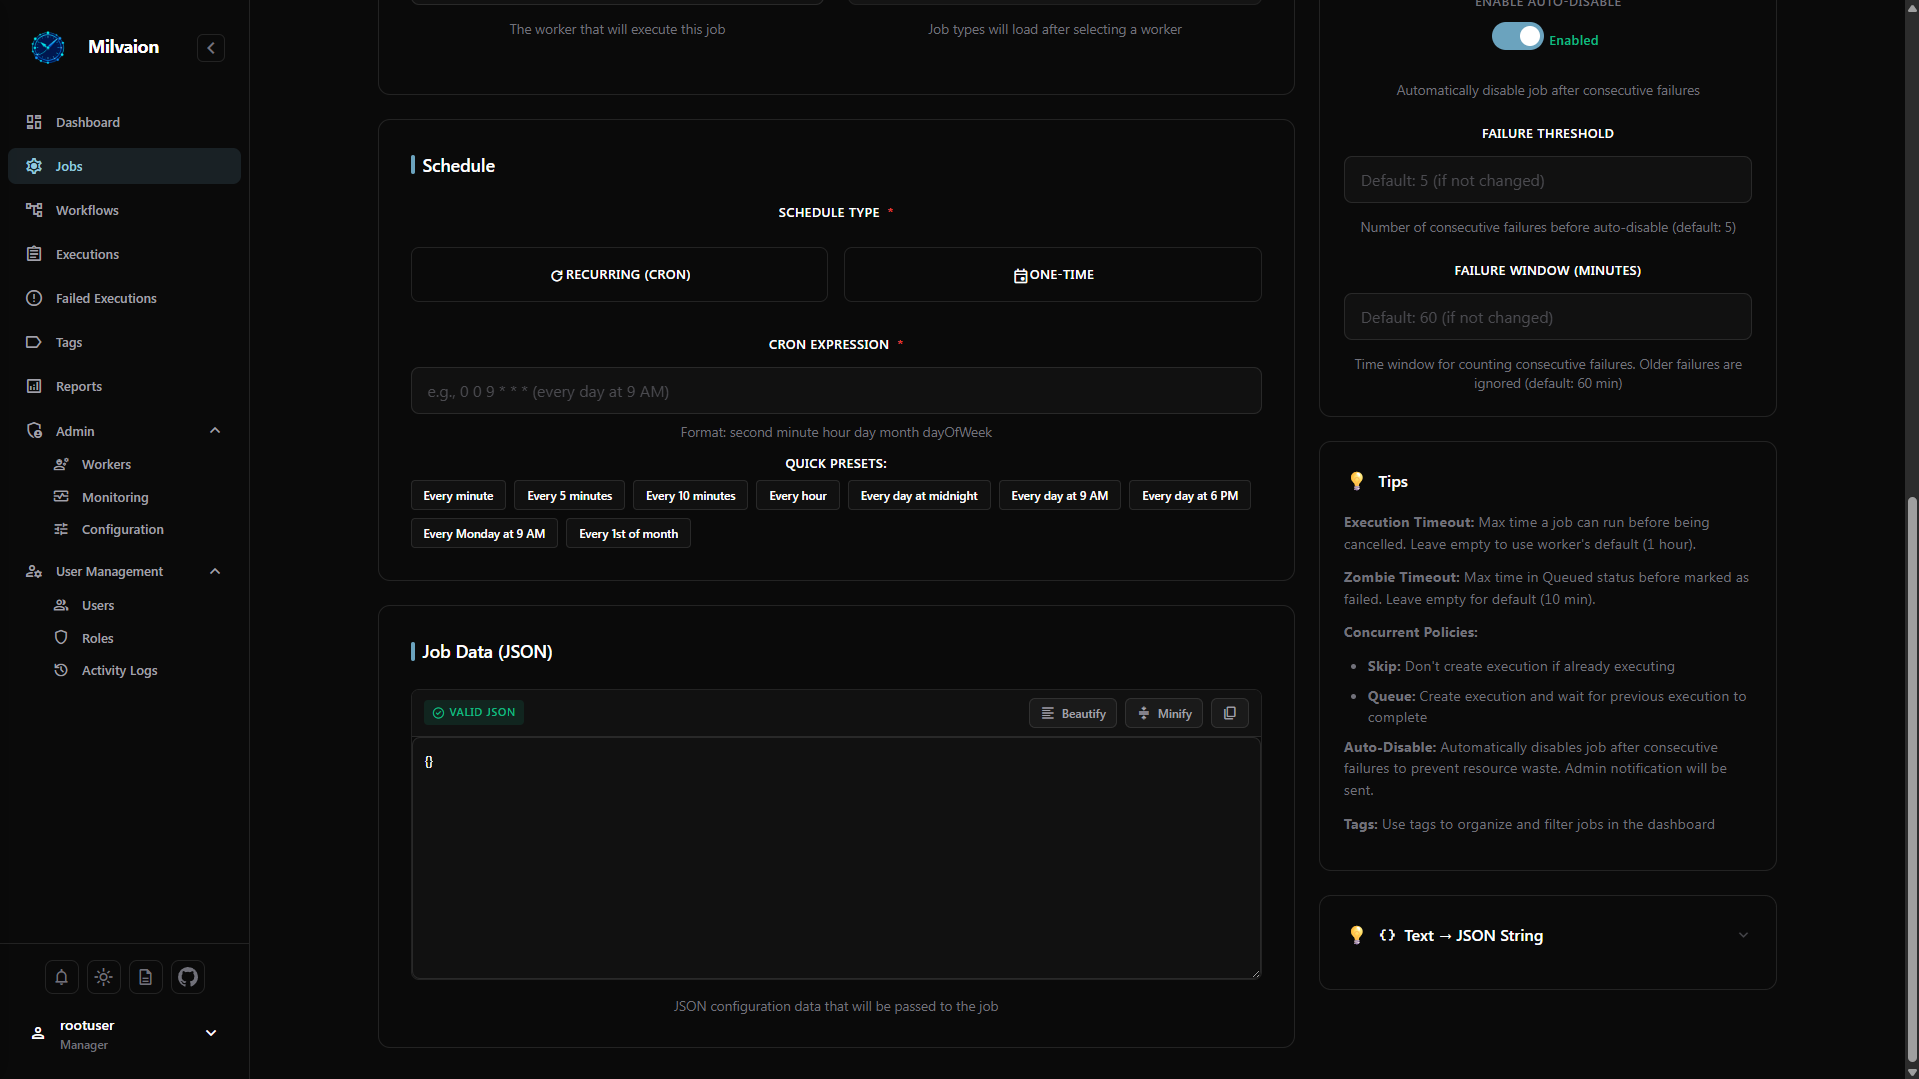
Create / Edit Job
Create new jobs or modify existing ones through an intuitive form.
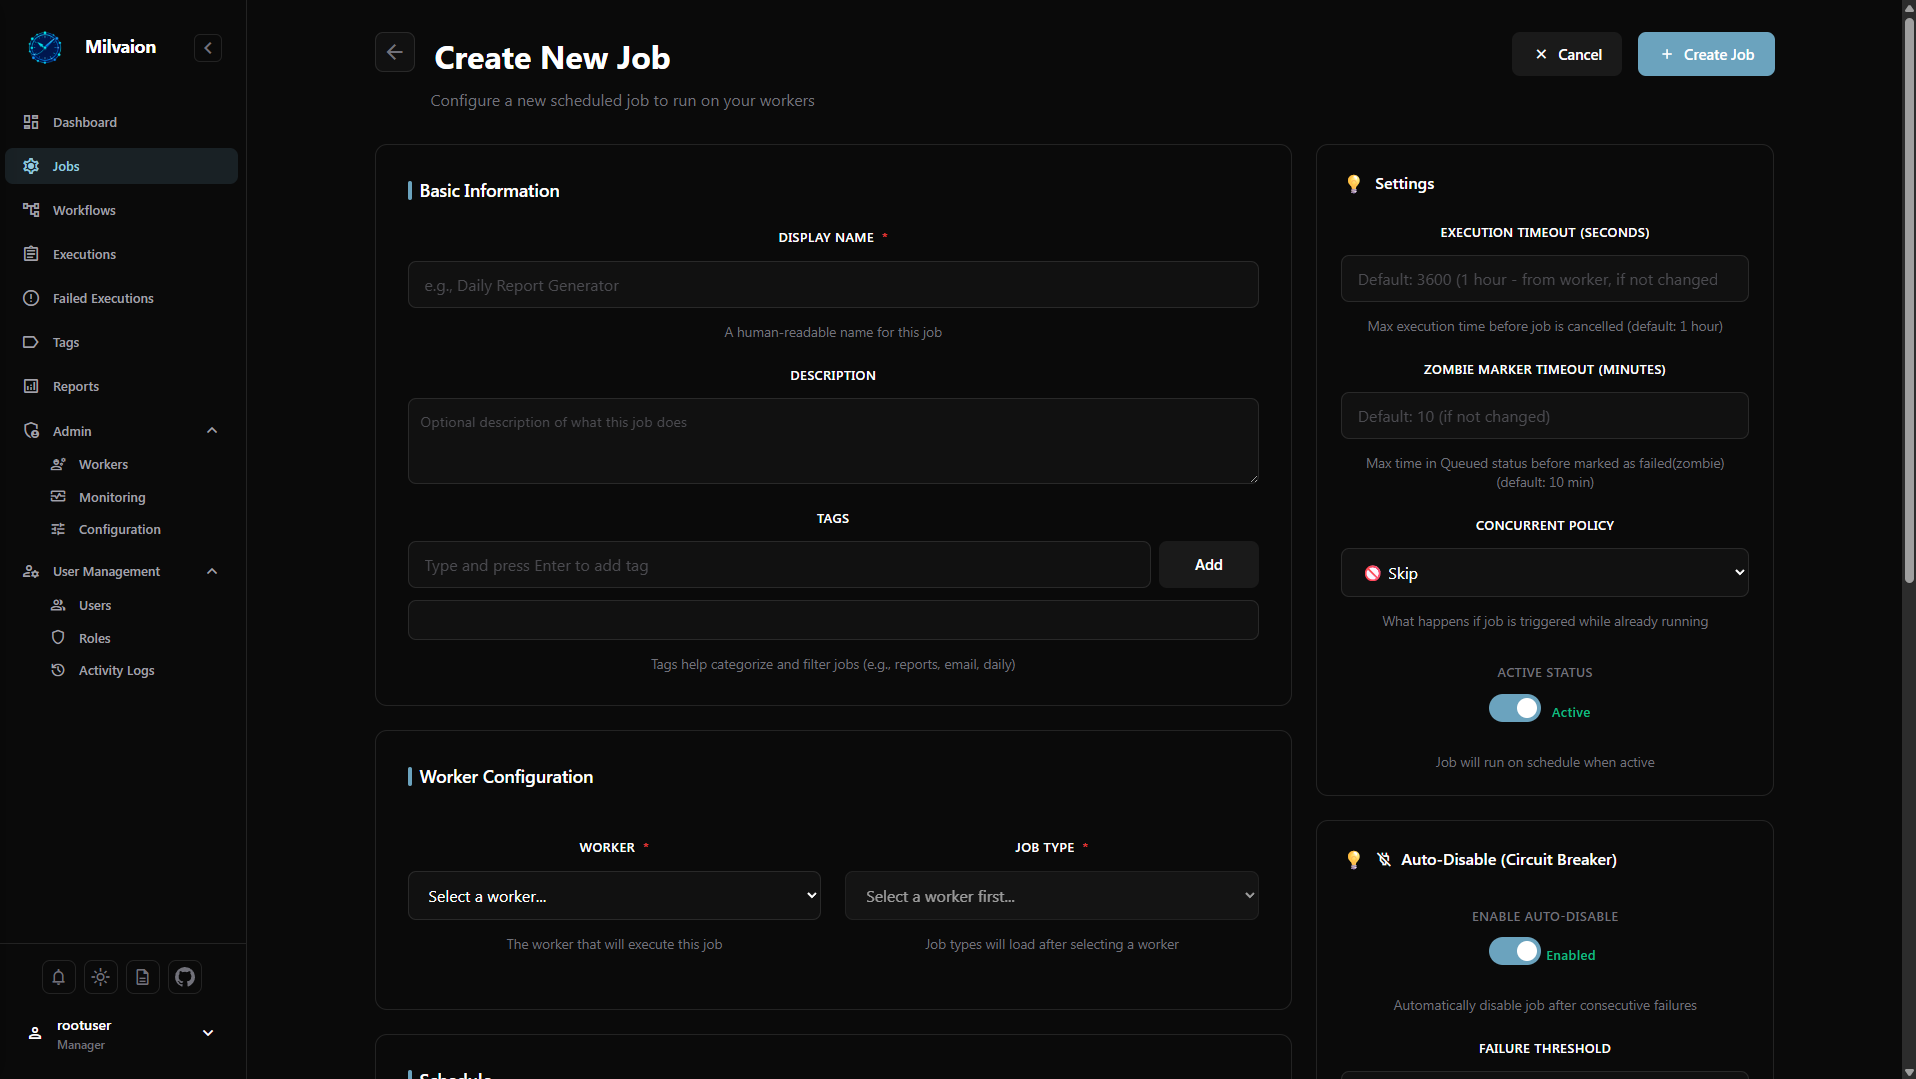
Configuration options:
- Job type selection (autofill workers and job types)
- Job data schema definition (autofill from worker)
- Cron expression builder with preview
- Job data (JSON payload)
- Timeout and retry settings
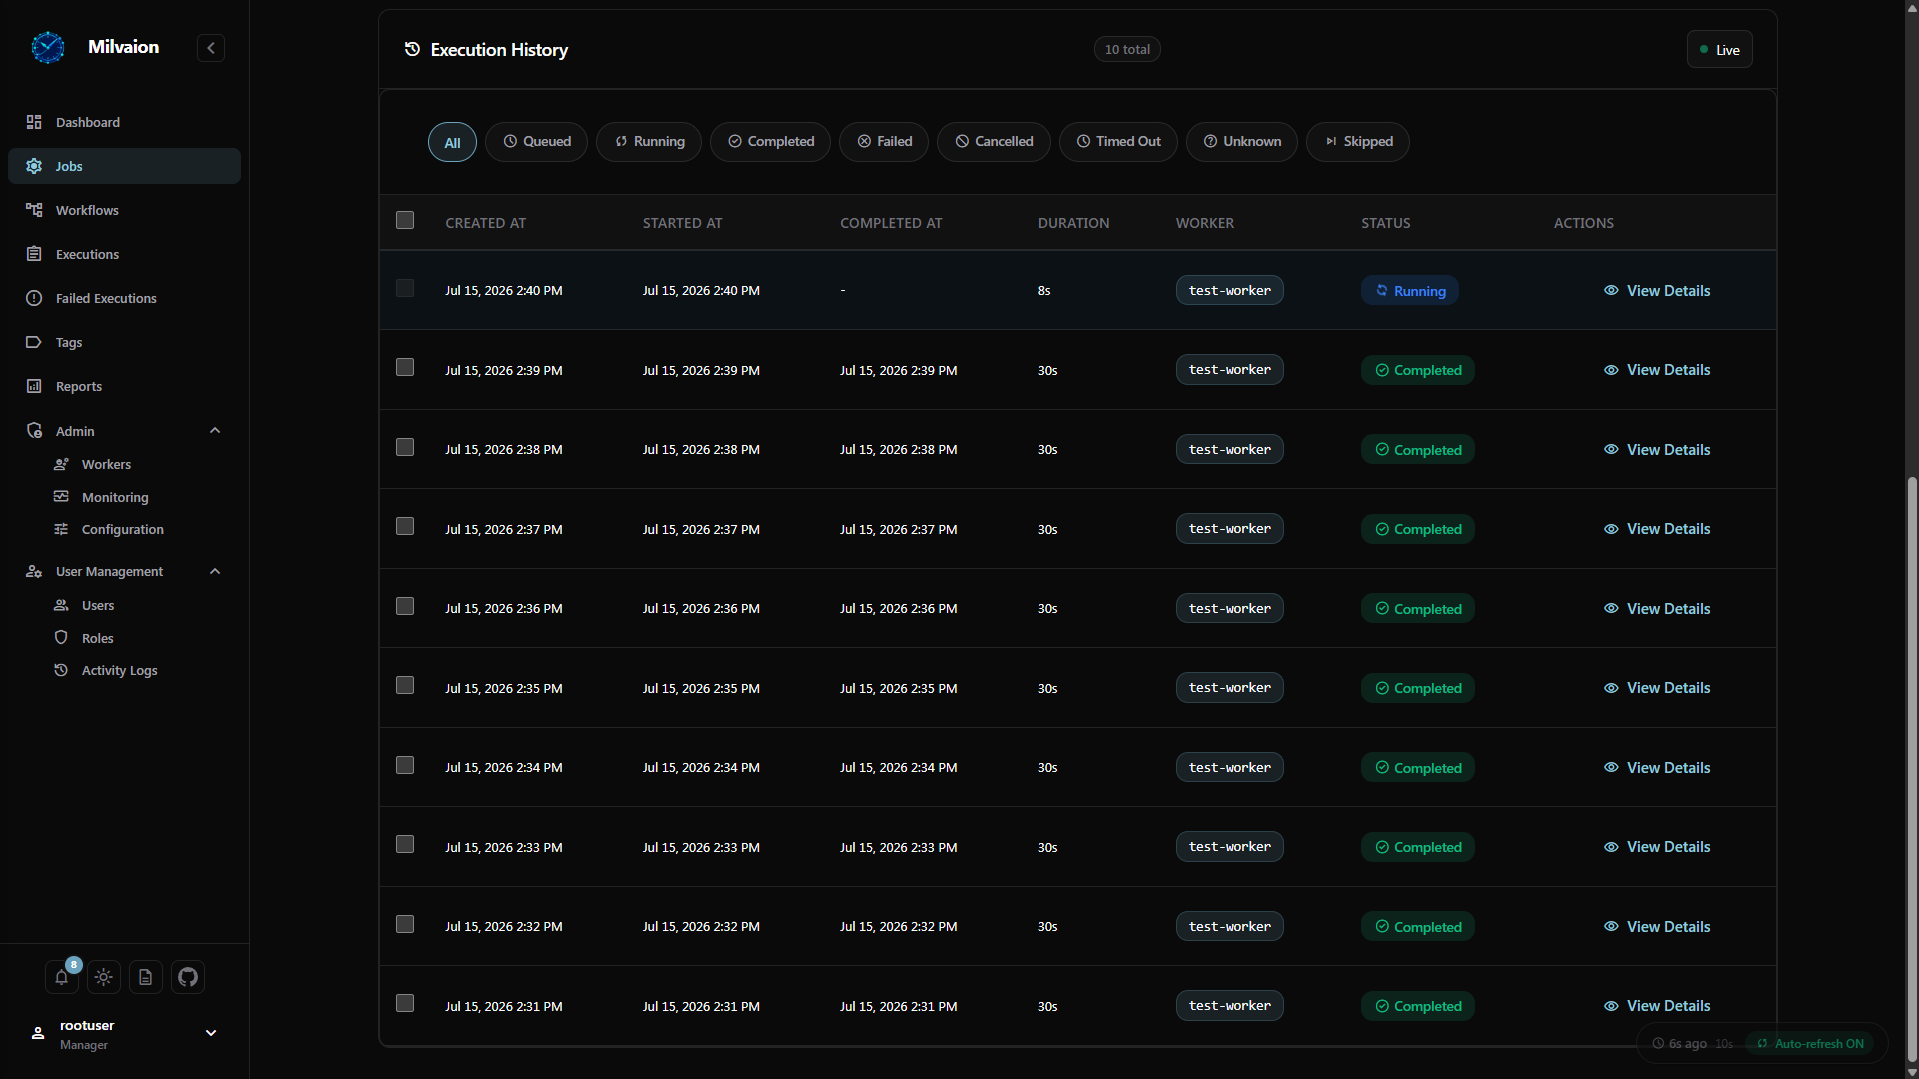
Occurrences
Occurrence List
View all job executions with detailed status information.
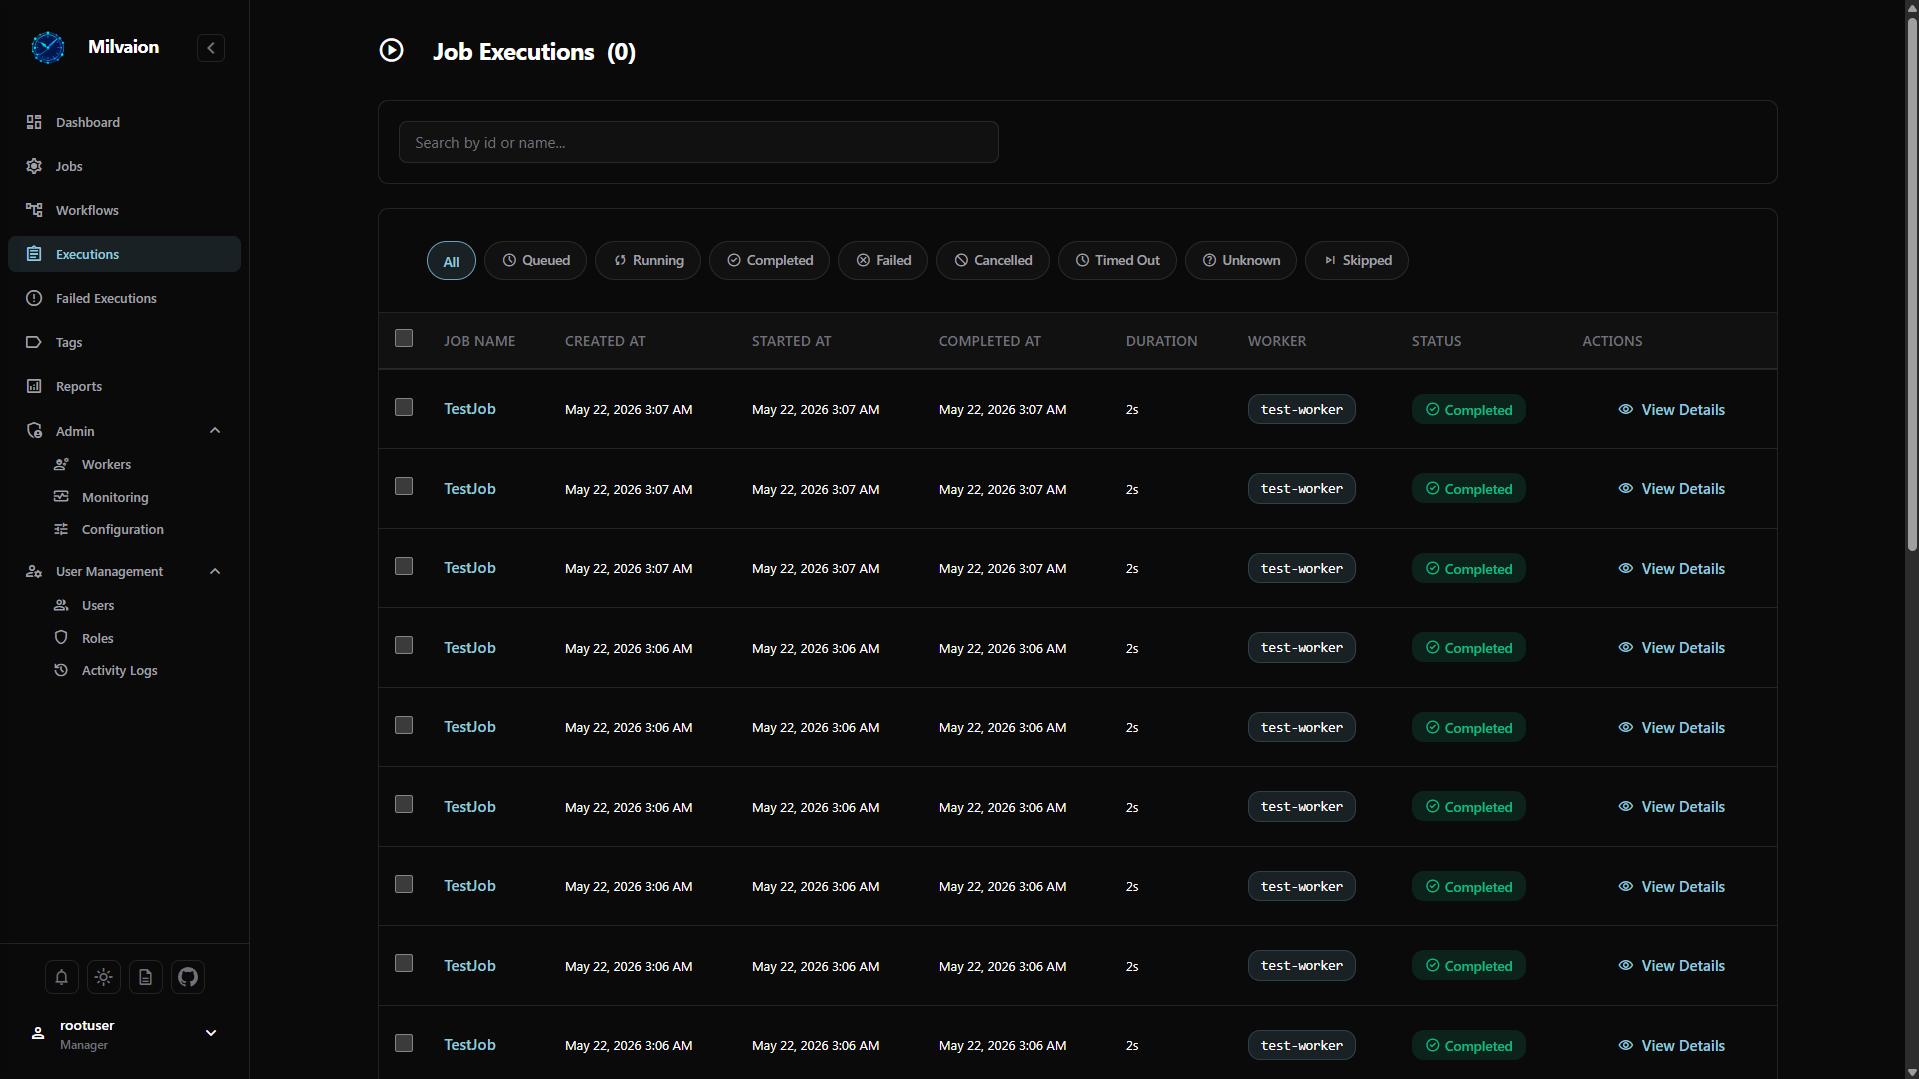
View execution creations and updates in real-time.
Occurrence Details
Drill down into a specific execution for troubleshooting.
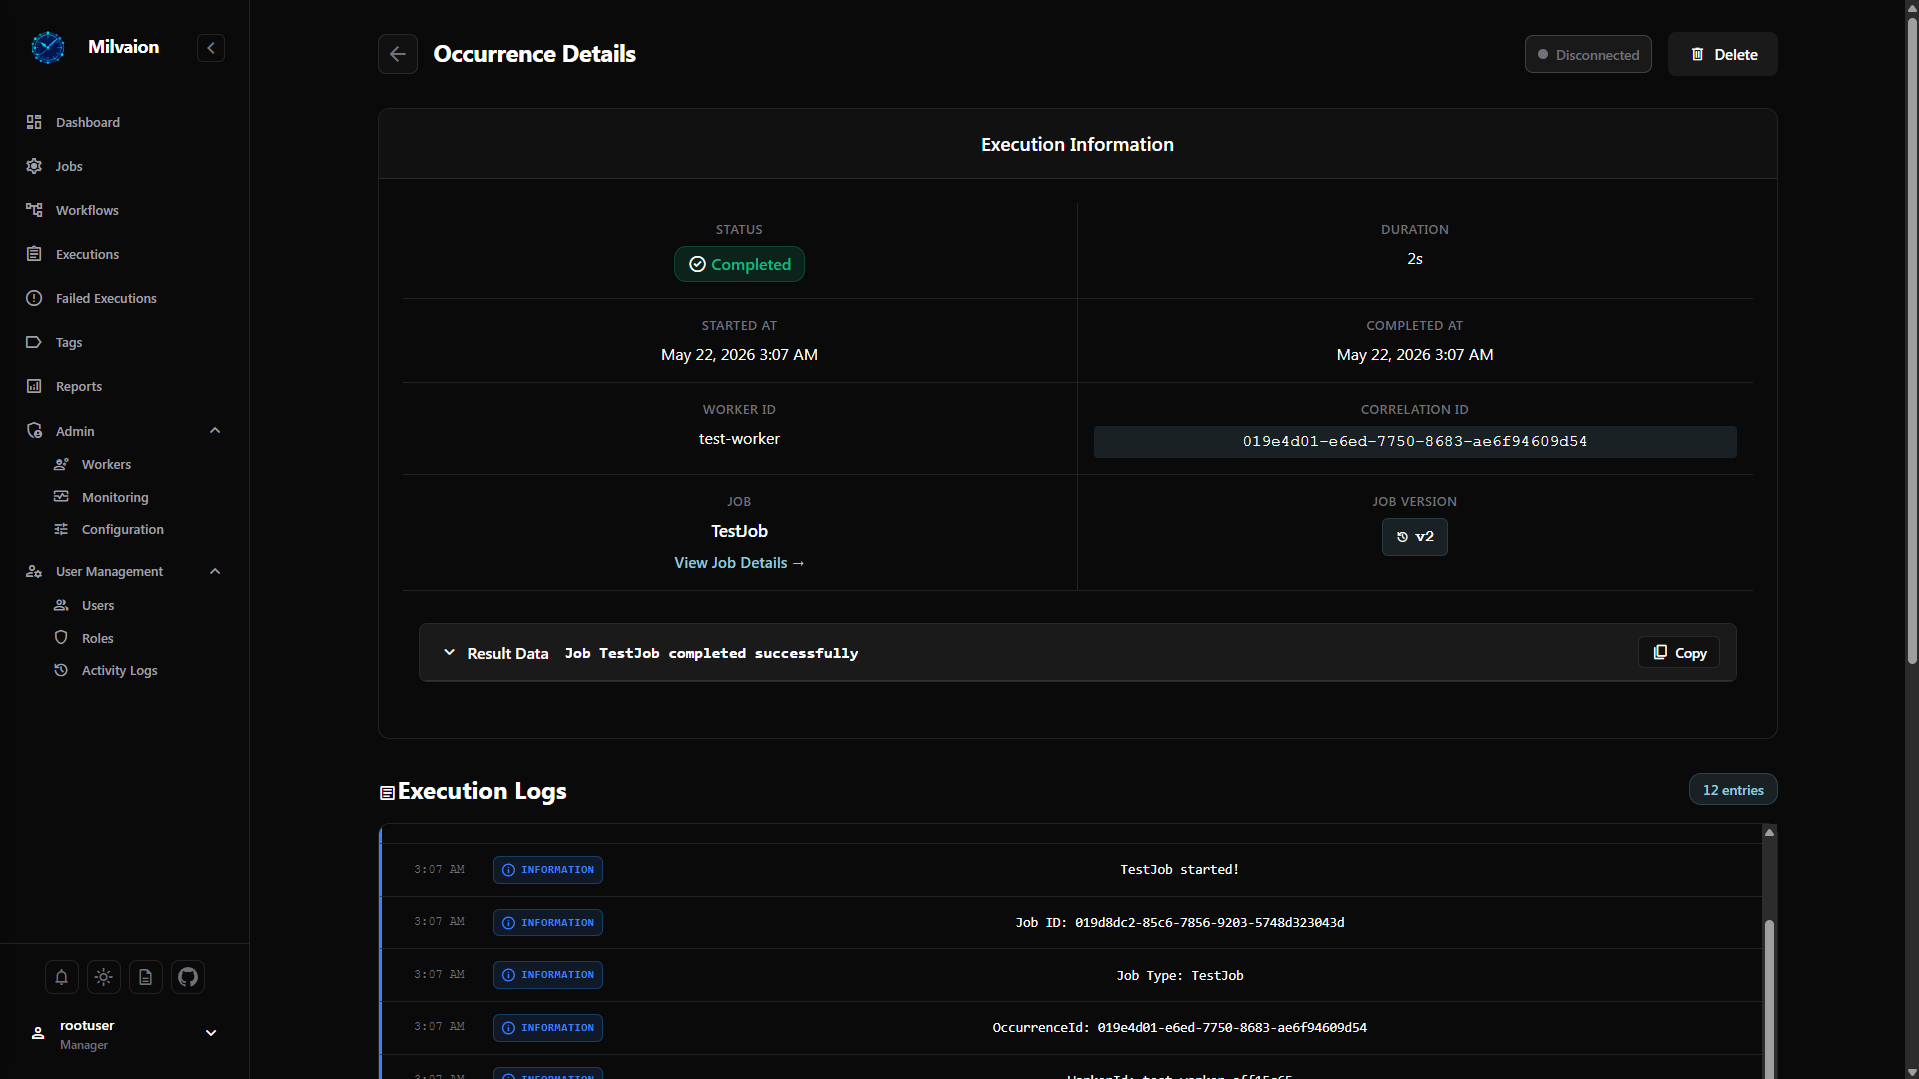
Details included:
- Execution timeline
- User-friendly logs
- Status change history
- Error details and stack trace (for failed jobs)
- Job data snapshot
Occurrence Logs
View execution logs for debugging and monitoring.
Upcoming Executions
Shows what runs next - scheduled jobs and workflows on one timeline, earliest first.
Unlike the job list, which shows how jobs are configured, this screen reads the live schedule the dispatcher polls. It is the place to look after a deploy, or when somebody asks why a job did not run.
Columns:
- When - a live countdown plus the absolute time
- Name and tags
- Type - Job or Workflow
- Schedule - the cron expression, or "one-time"
- Target - worker and job name
- Status
Filters: time window (1 hour to 7 days), jobs or workflows, name search, and an Only problems toggle.
Status values:
| Status | Meaning |
|---|---|
| Scheduled | The dispatcher holds this time. It will fire. |
| Projected | Computed from the cron expression - workflows only. |
| Not scheduled | Active and recurring, but nothing will run it. |
| Invalid cron | The expression could not be parsed. |
Entries with no run time sort to the bottom and are marked down the left edge, so they stay findable in a long list. A banner at the top reports how many there are, with a shortcut to filter down to just those.
Two banners signal trouble rather than data: one when the Redis scheduler is unreachable - without it, an outage would look like an empty schedule - and one when there are more recurring jobs than the health check inspects, meaning the count is a floor rather than a total.
See Monitoring for the underlying endpoint.
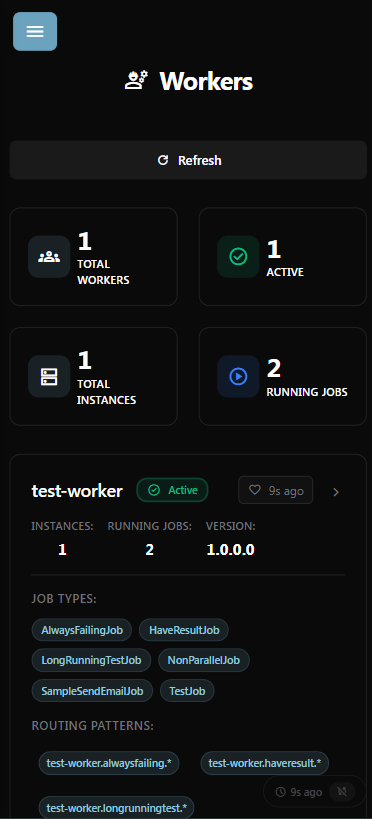
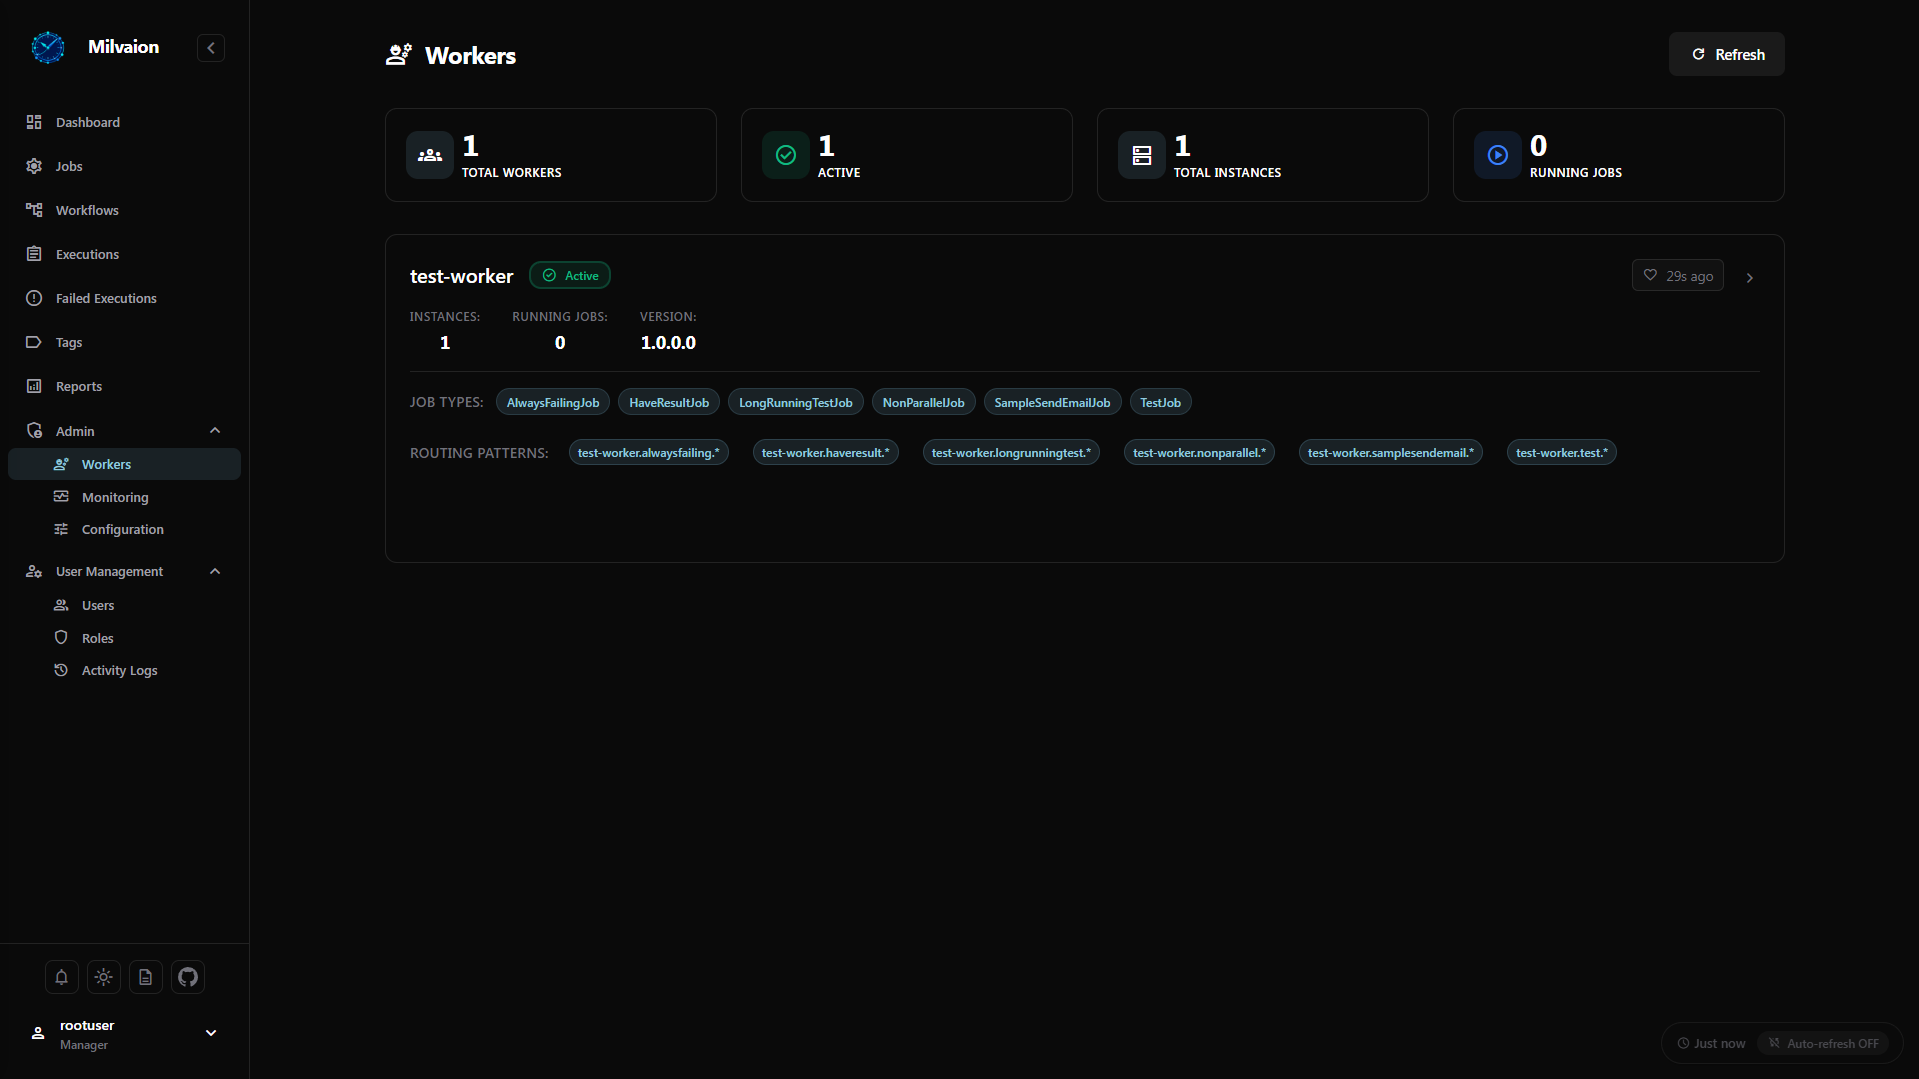
Workers
Worker List
Monitor all registered workers and their health status.
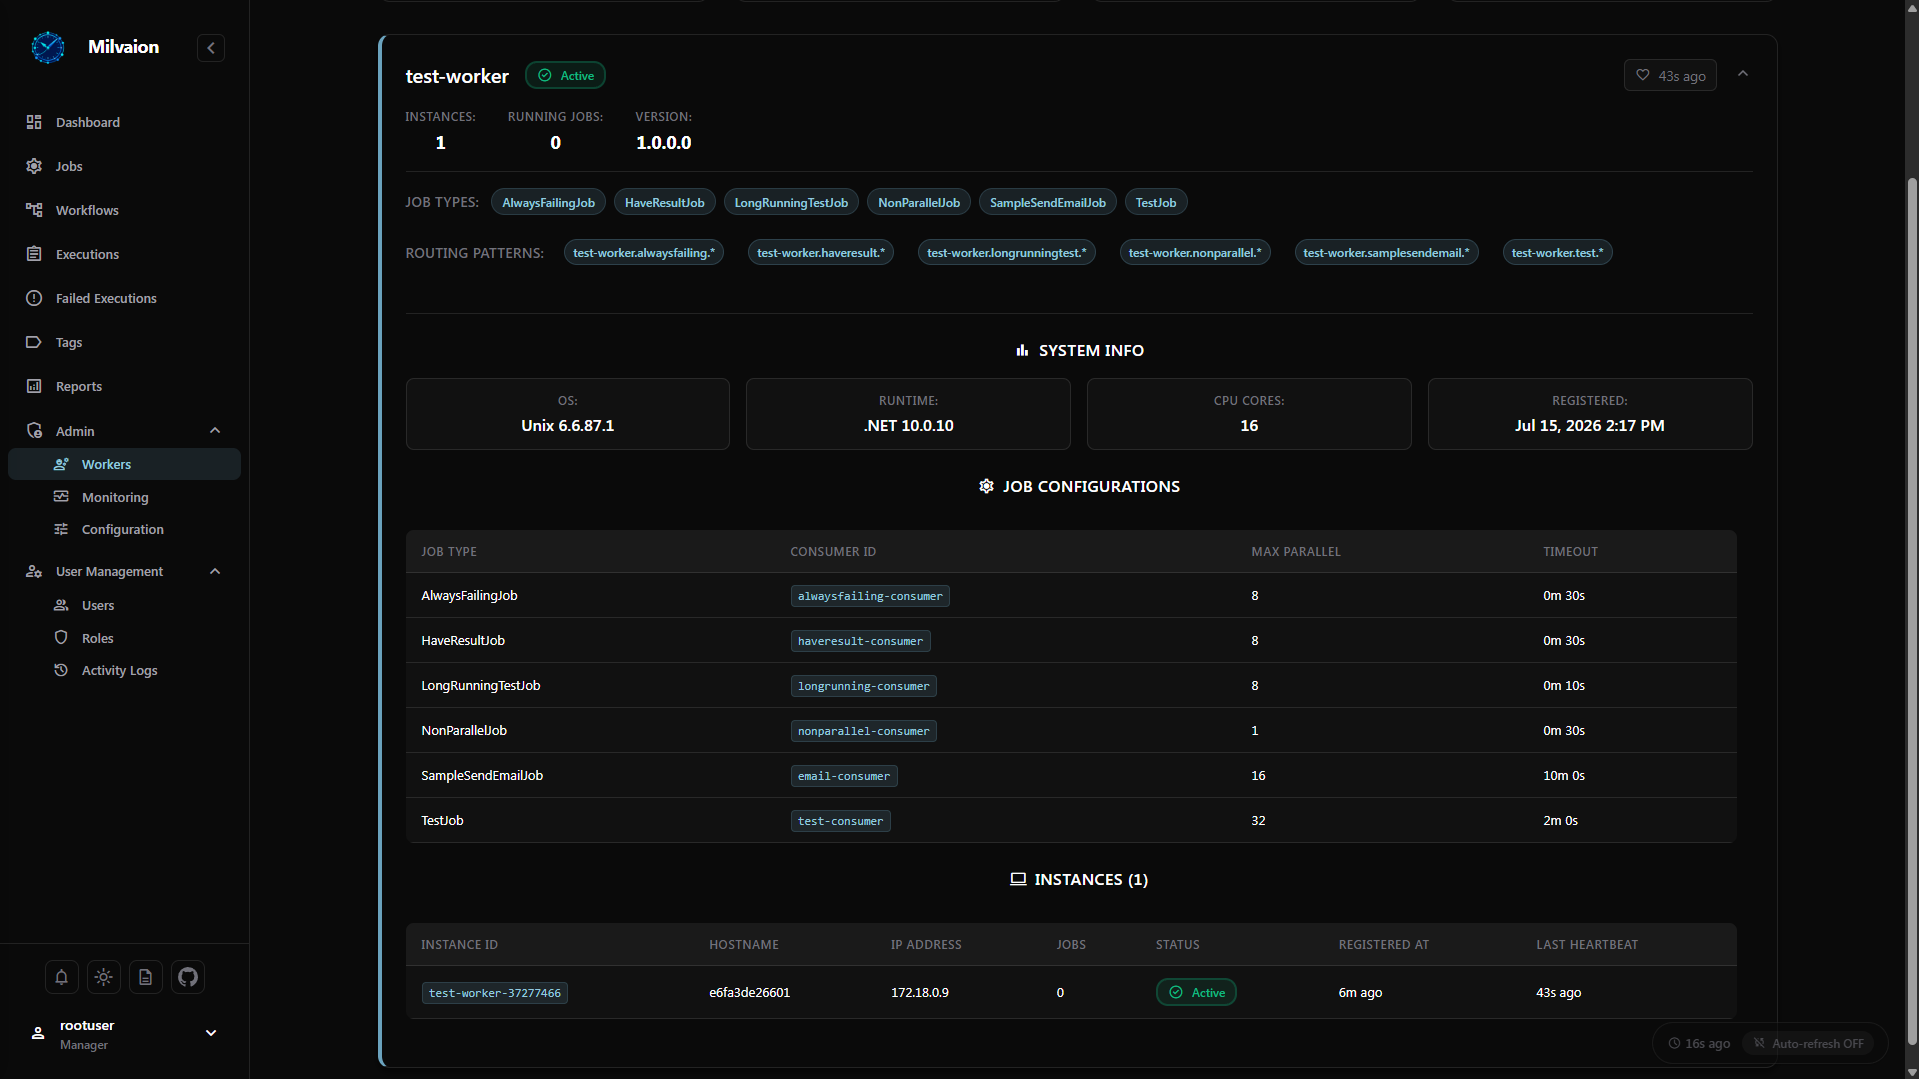
Worker Details
View detailed information about a specific worker instance.
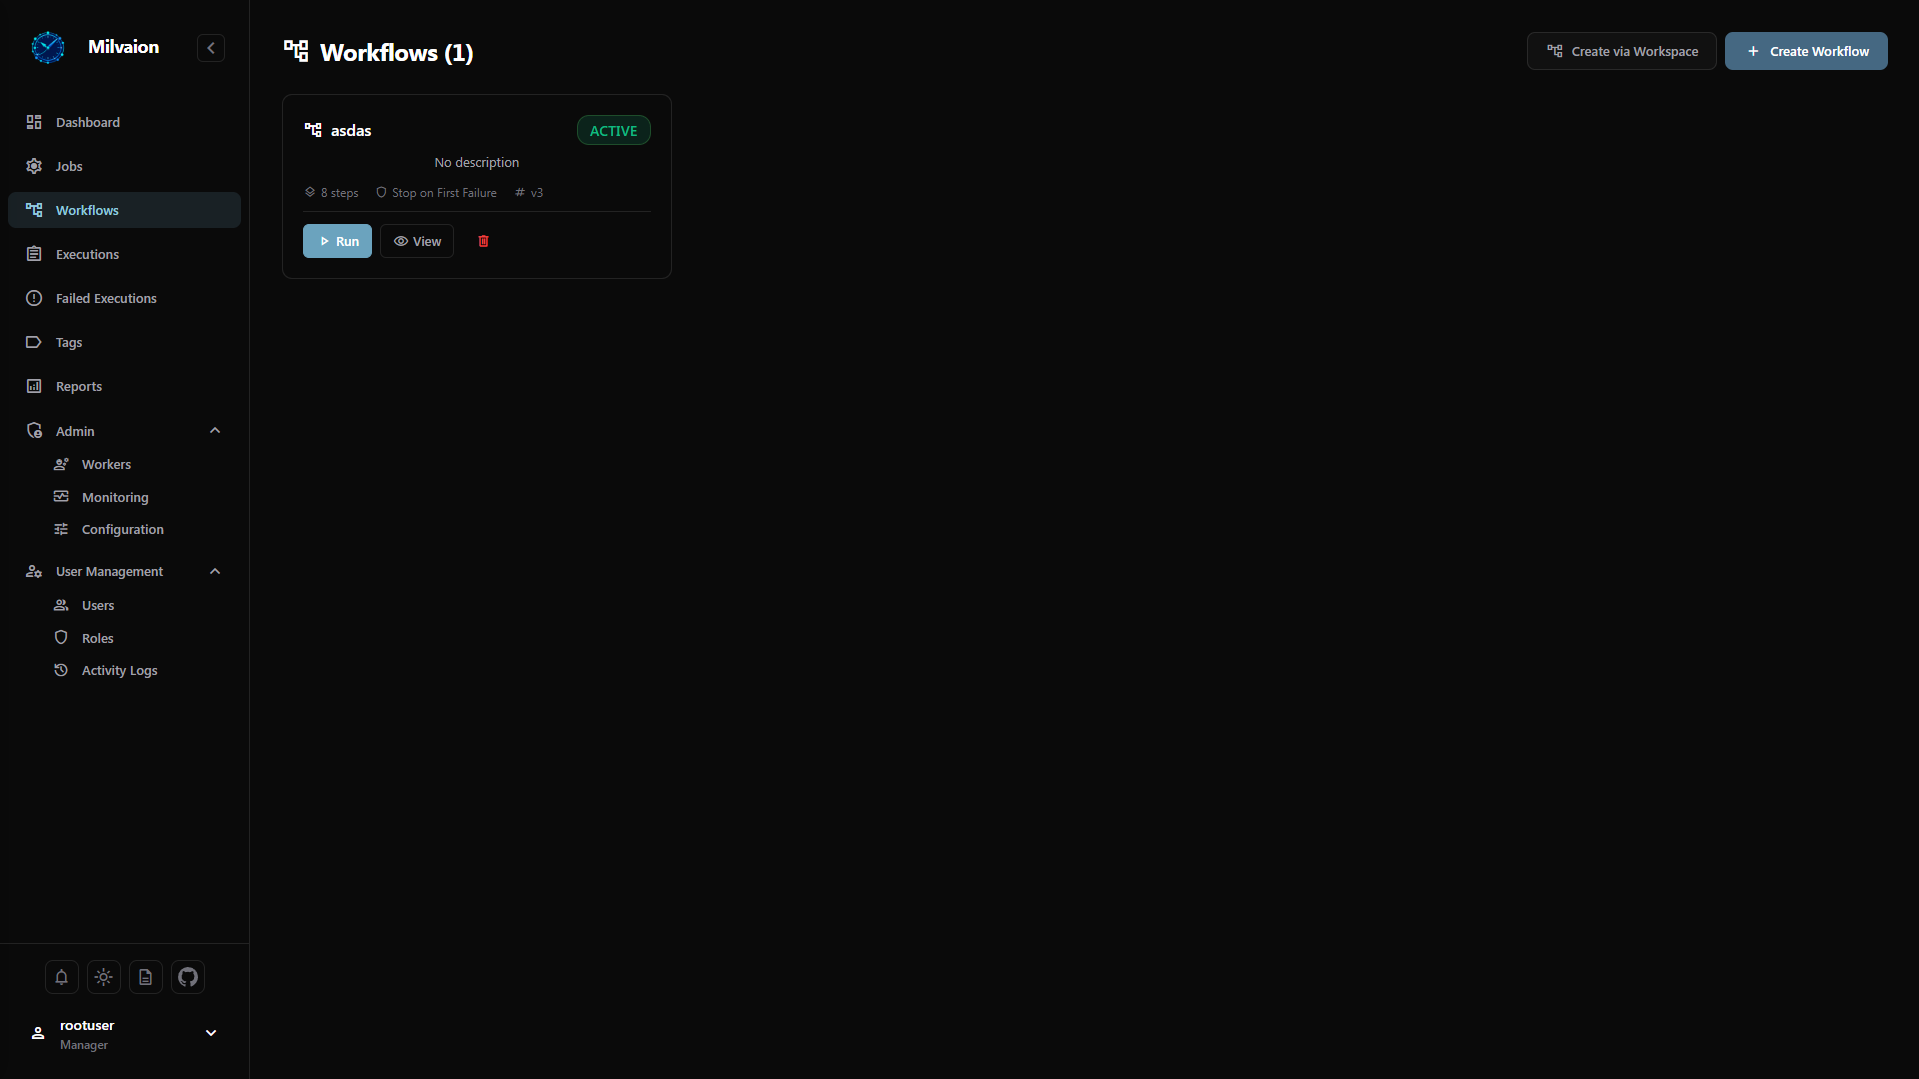
Workflows
Workflow List
Browse all defined workflows and their current states.
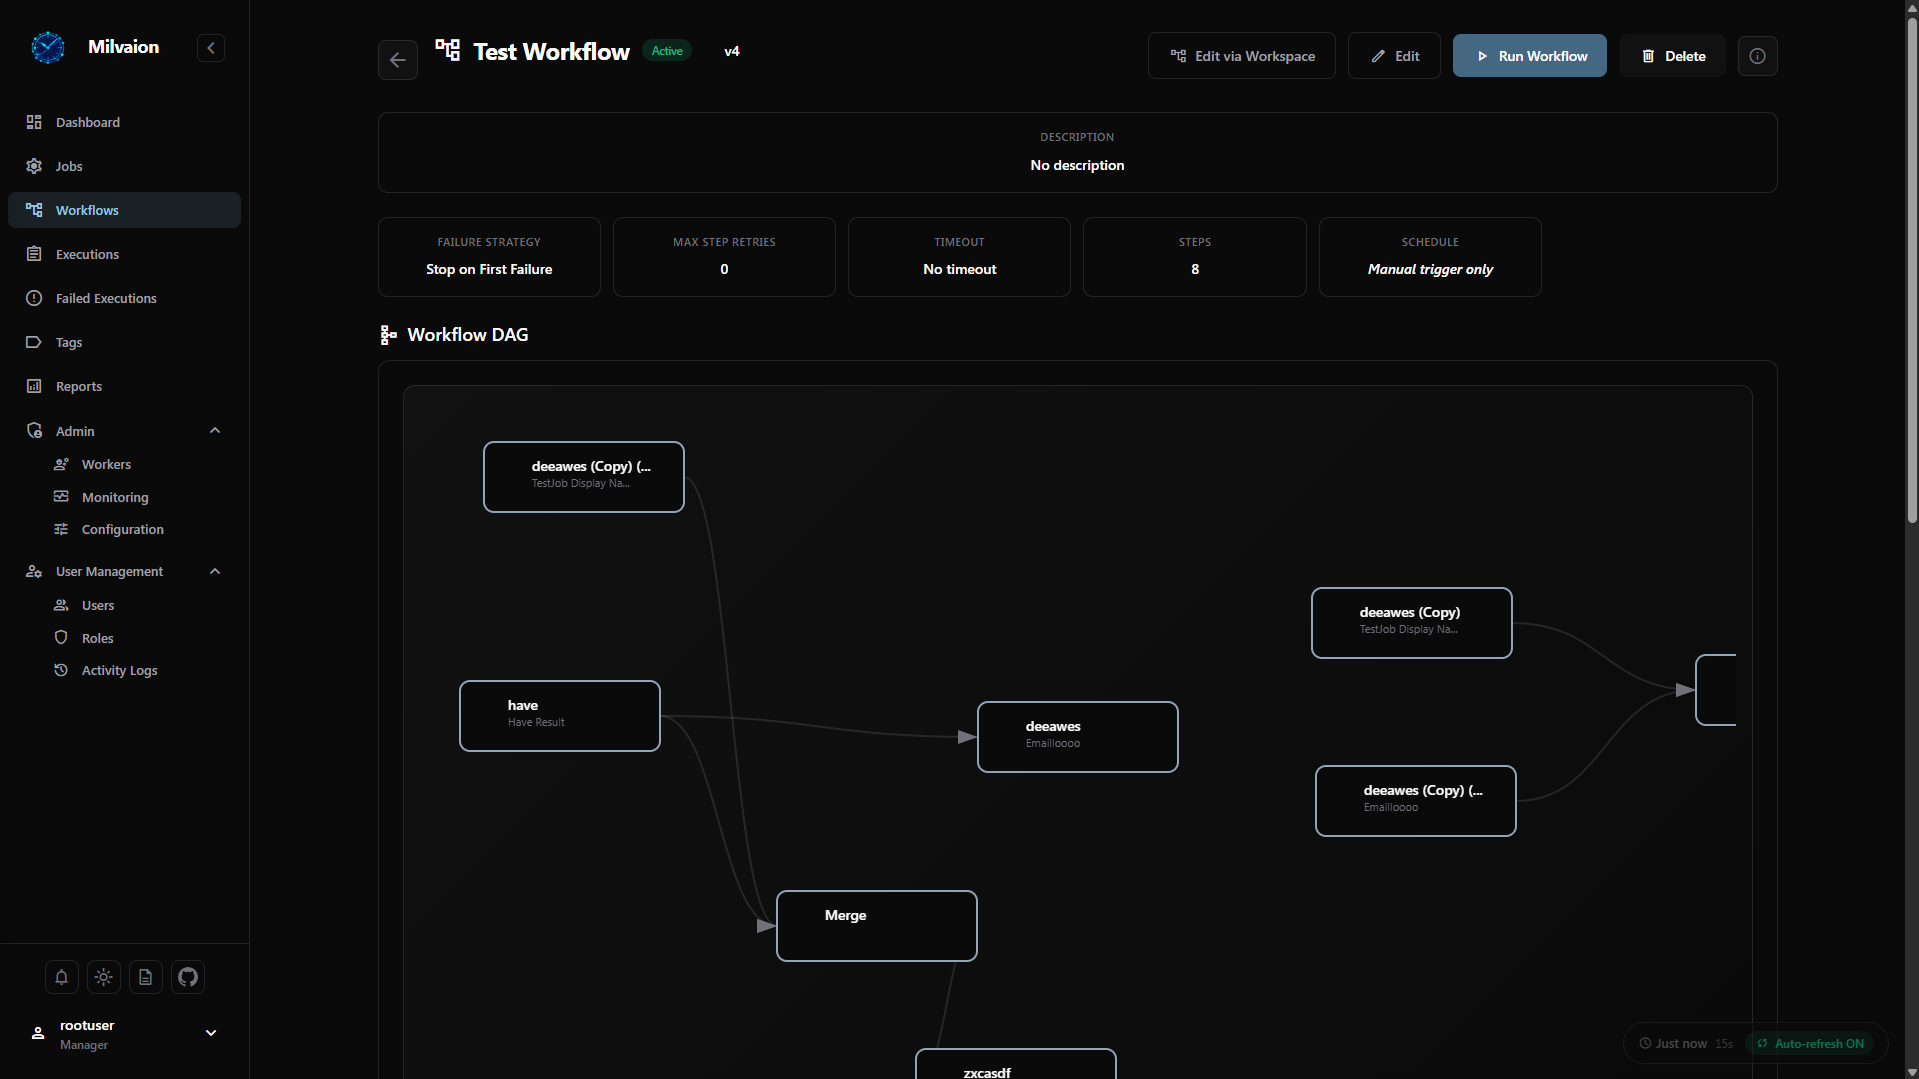
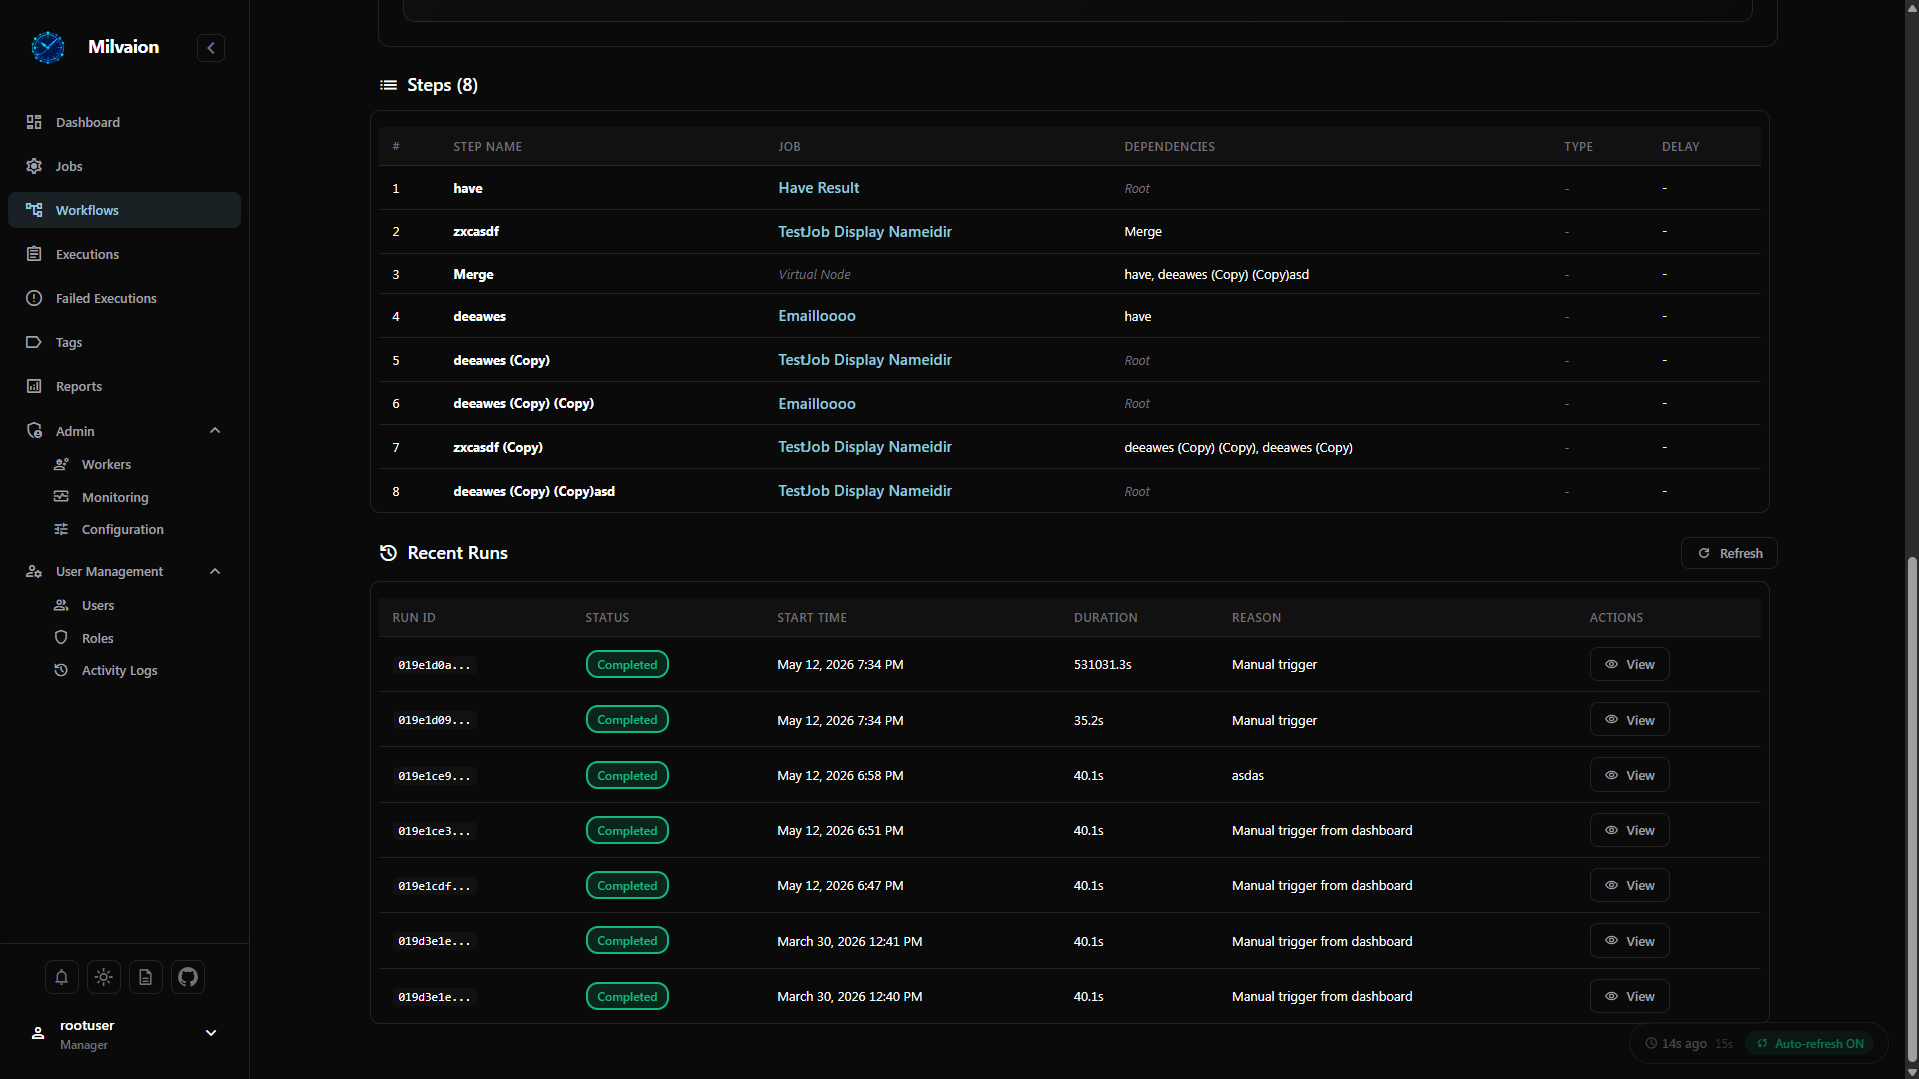
Workflow Details
View step-by-step details and execution history of a specific workflow.
Settings
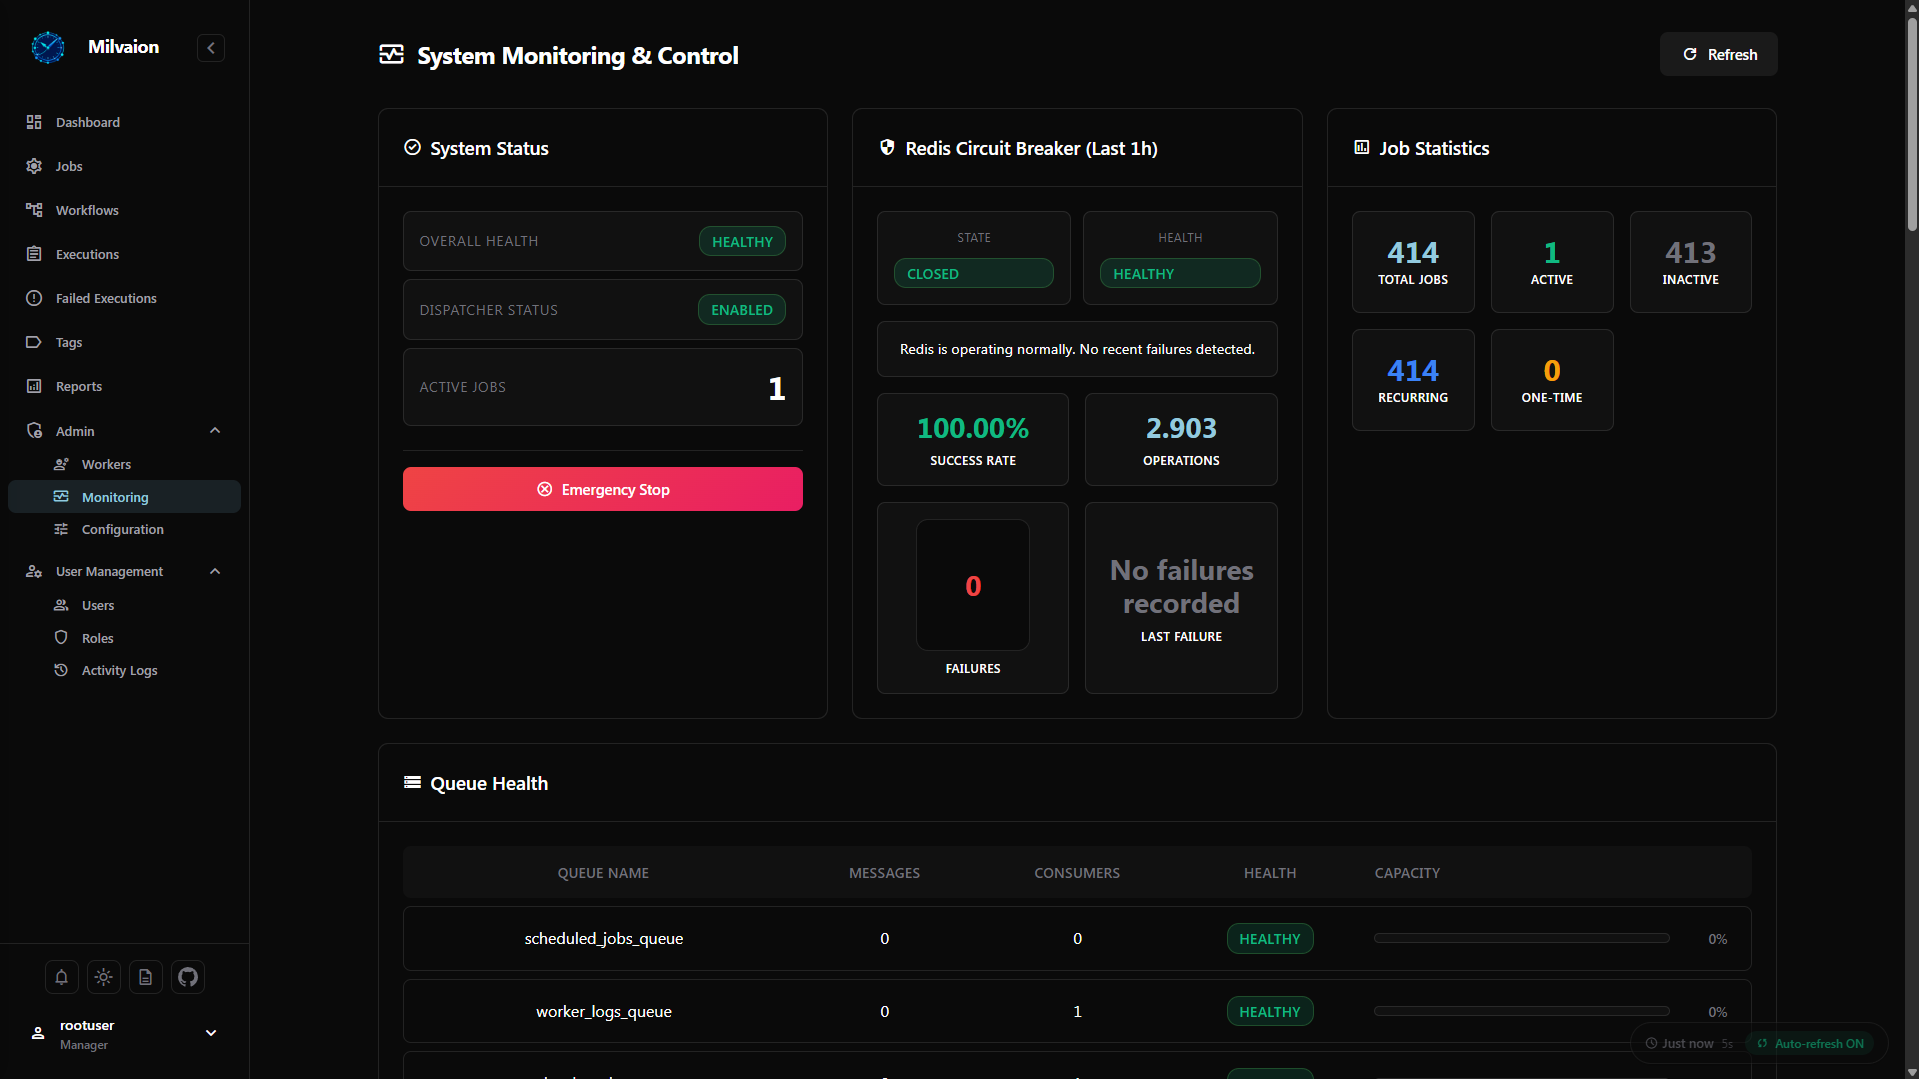
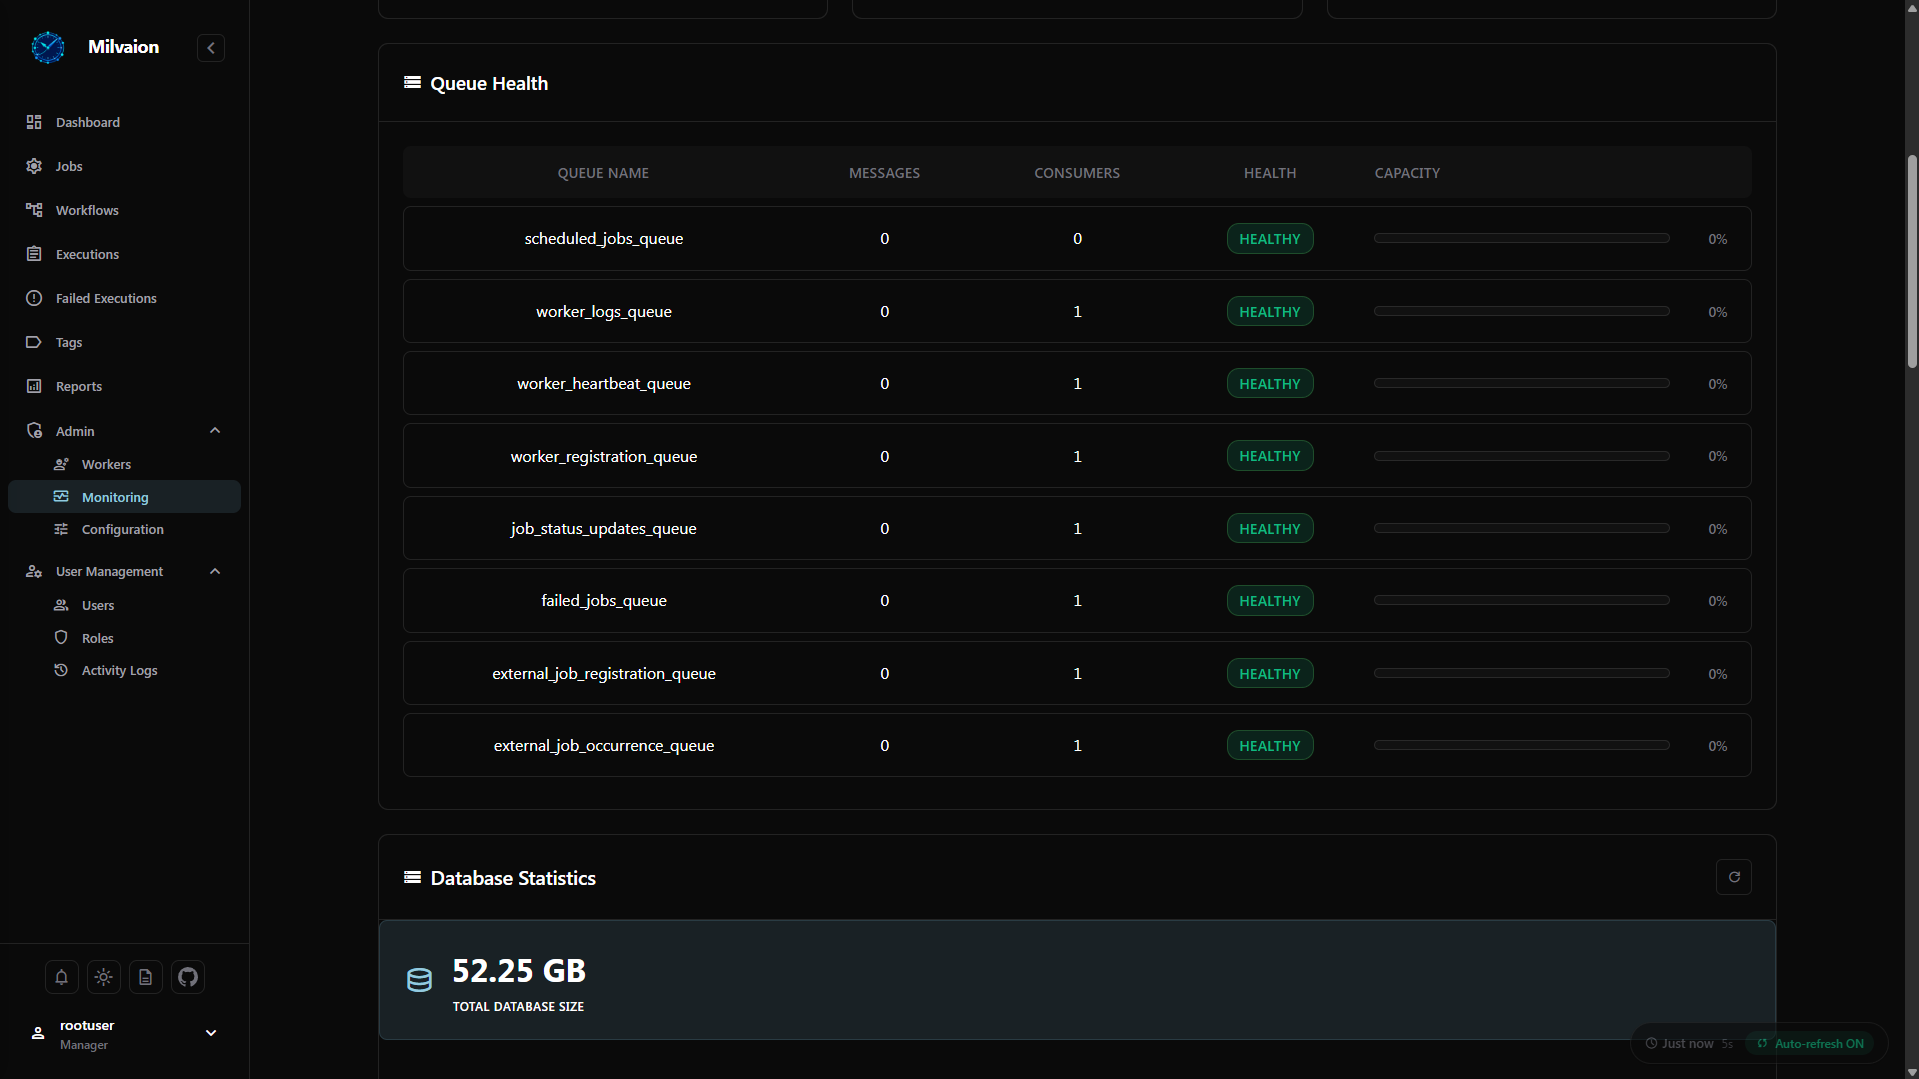
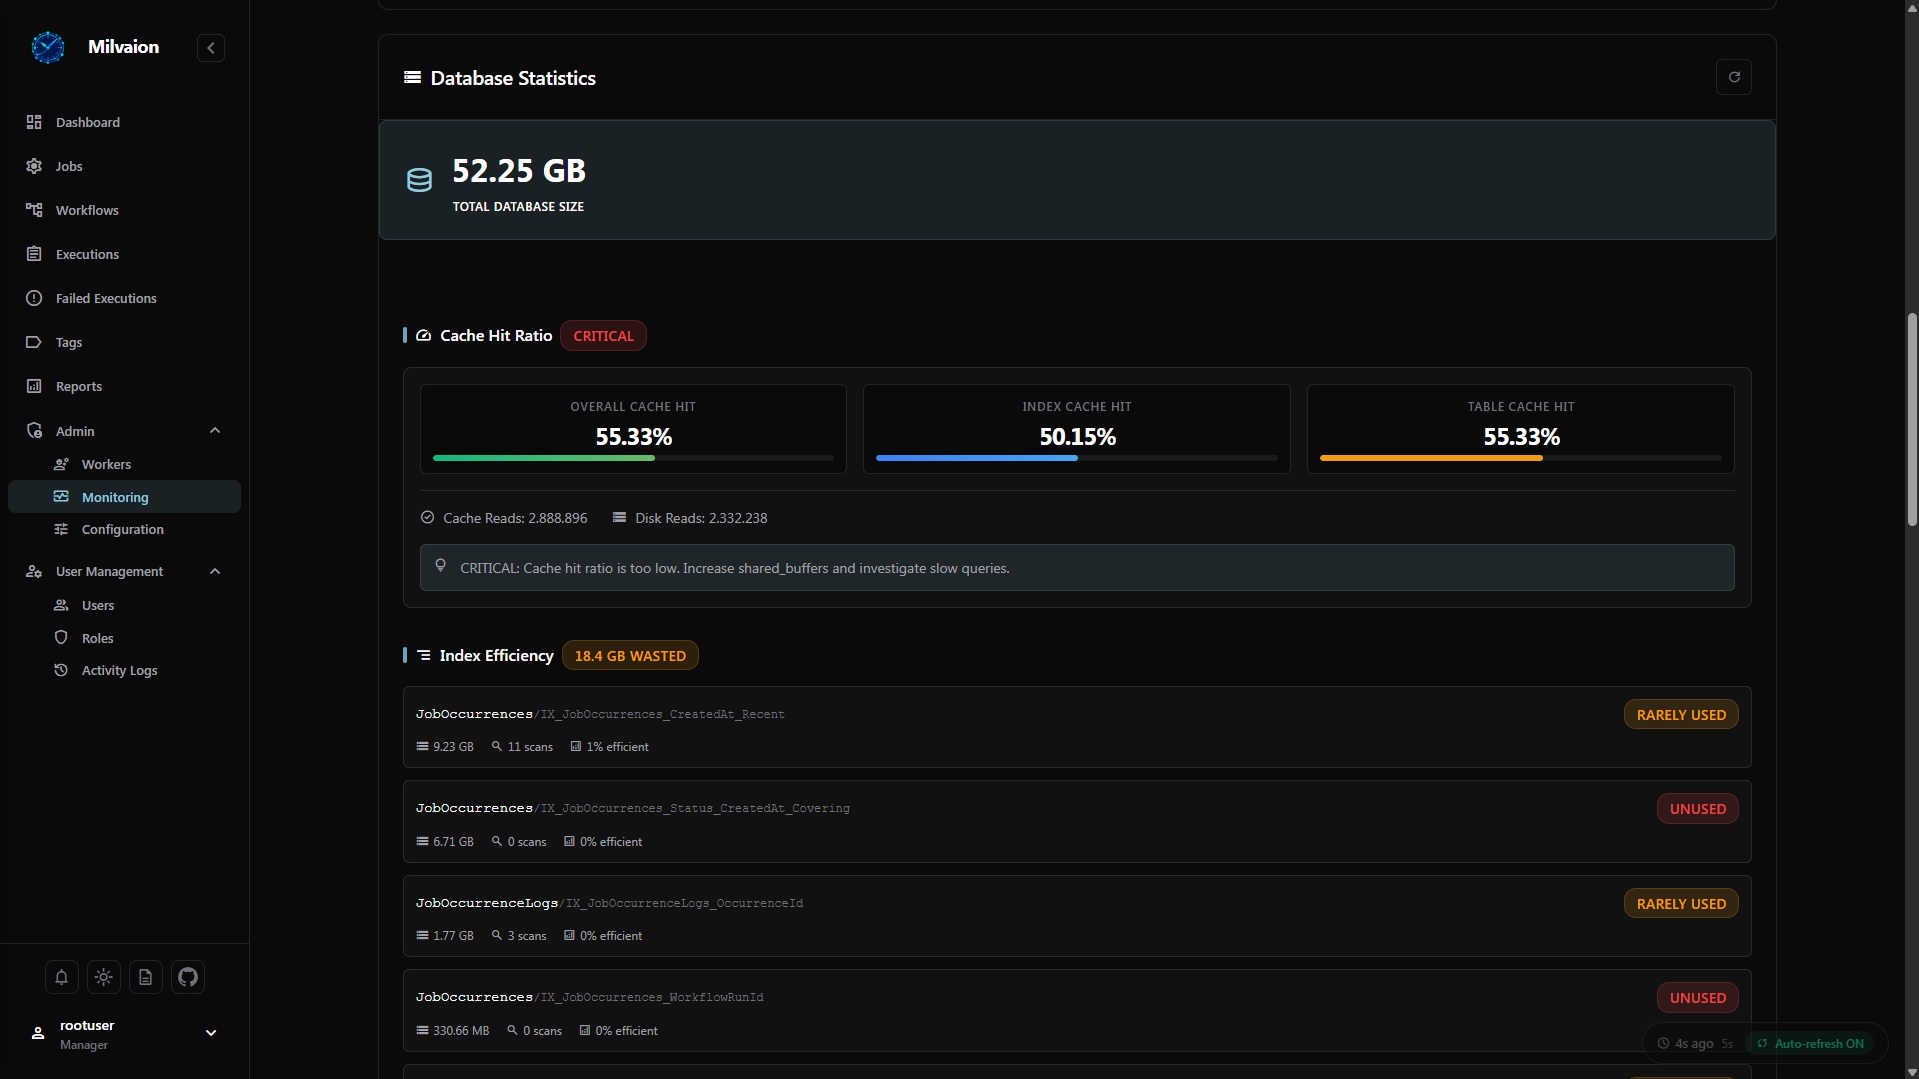
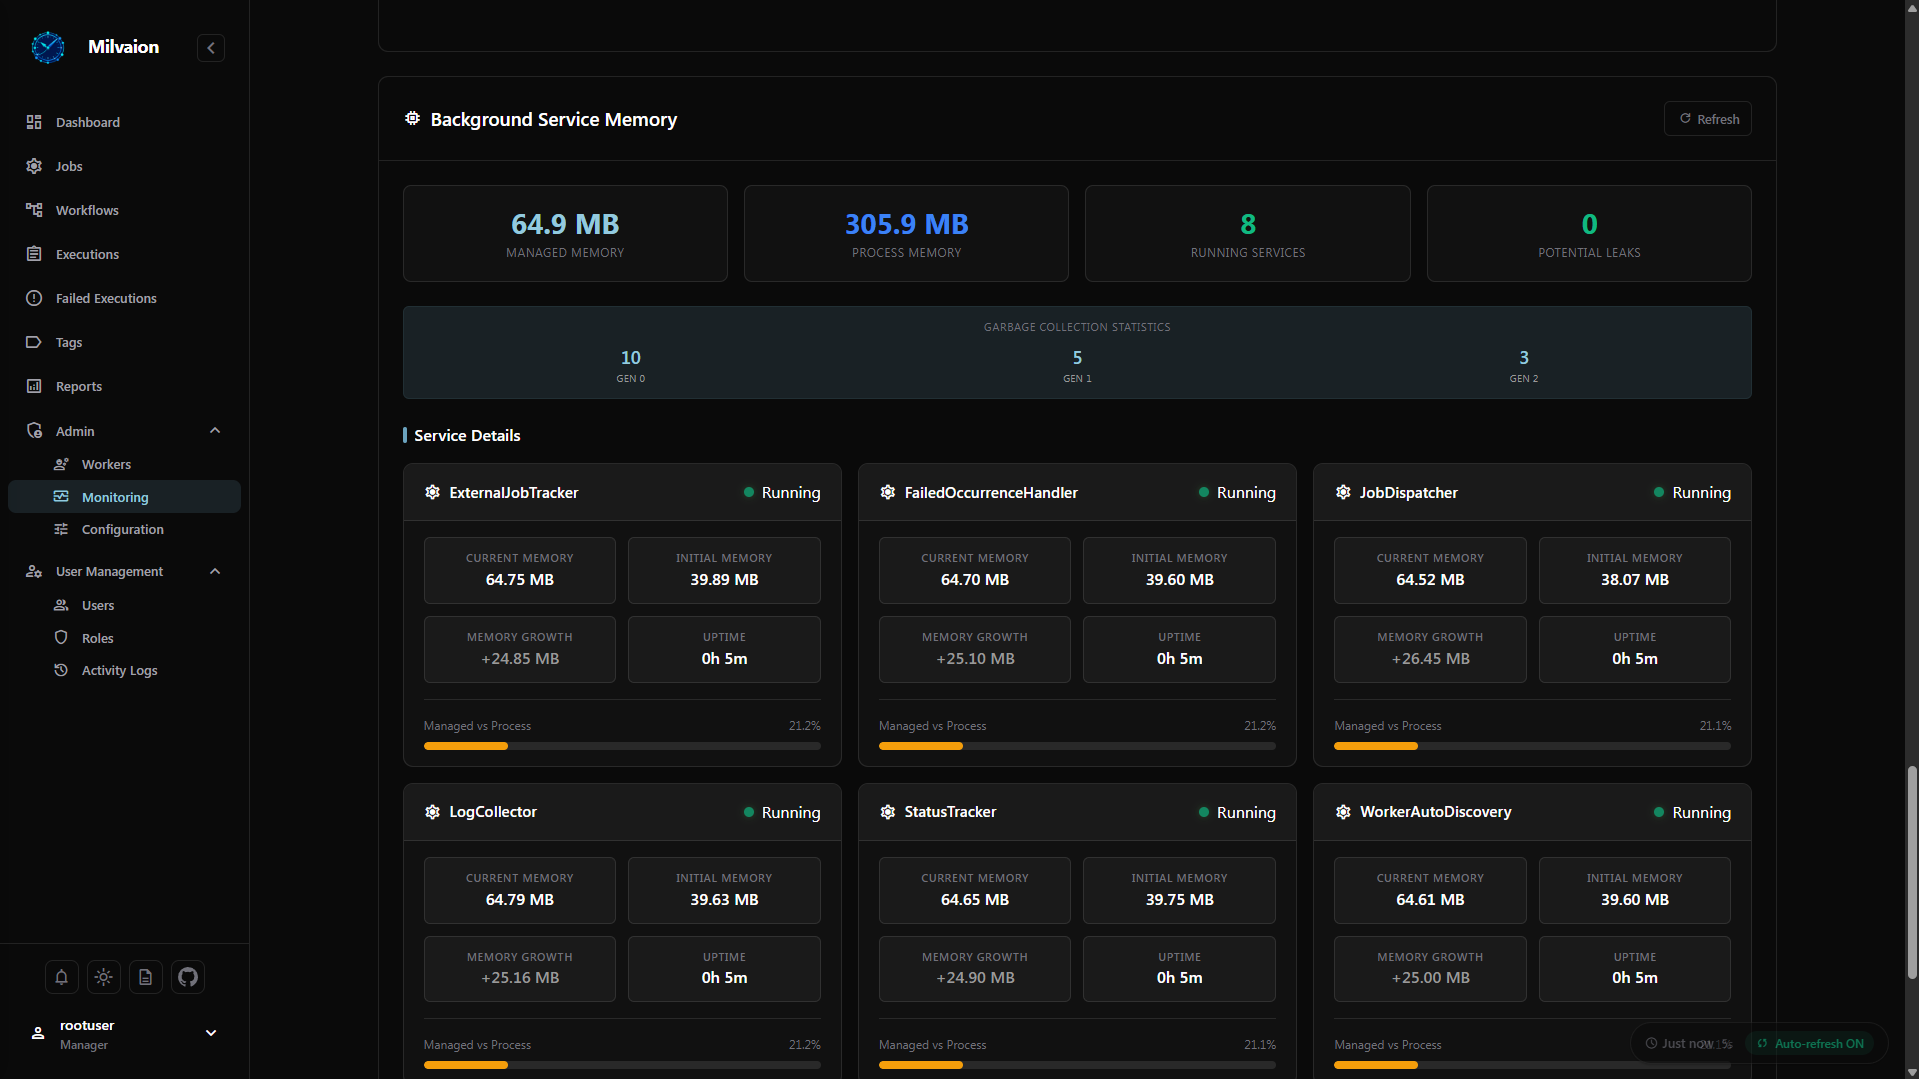
System Monitoring
View and manage system settings.
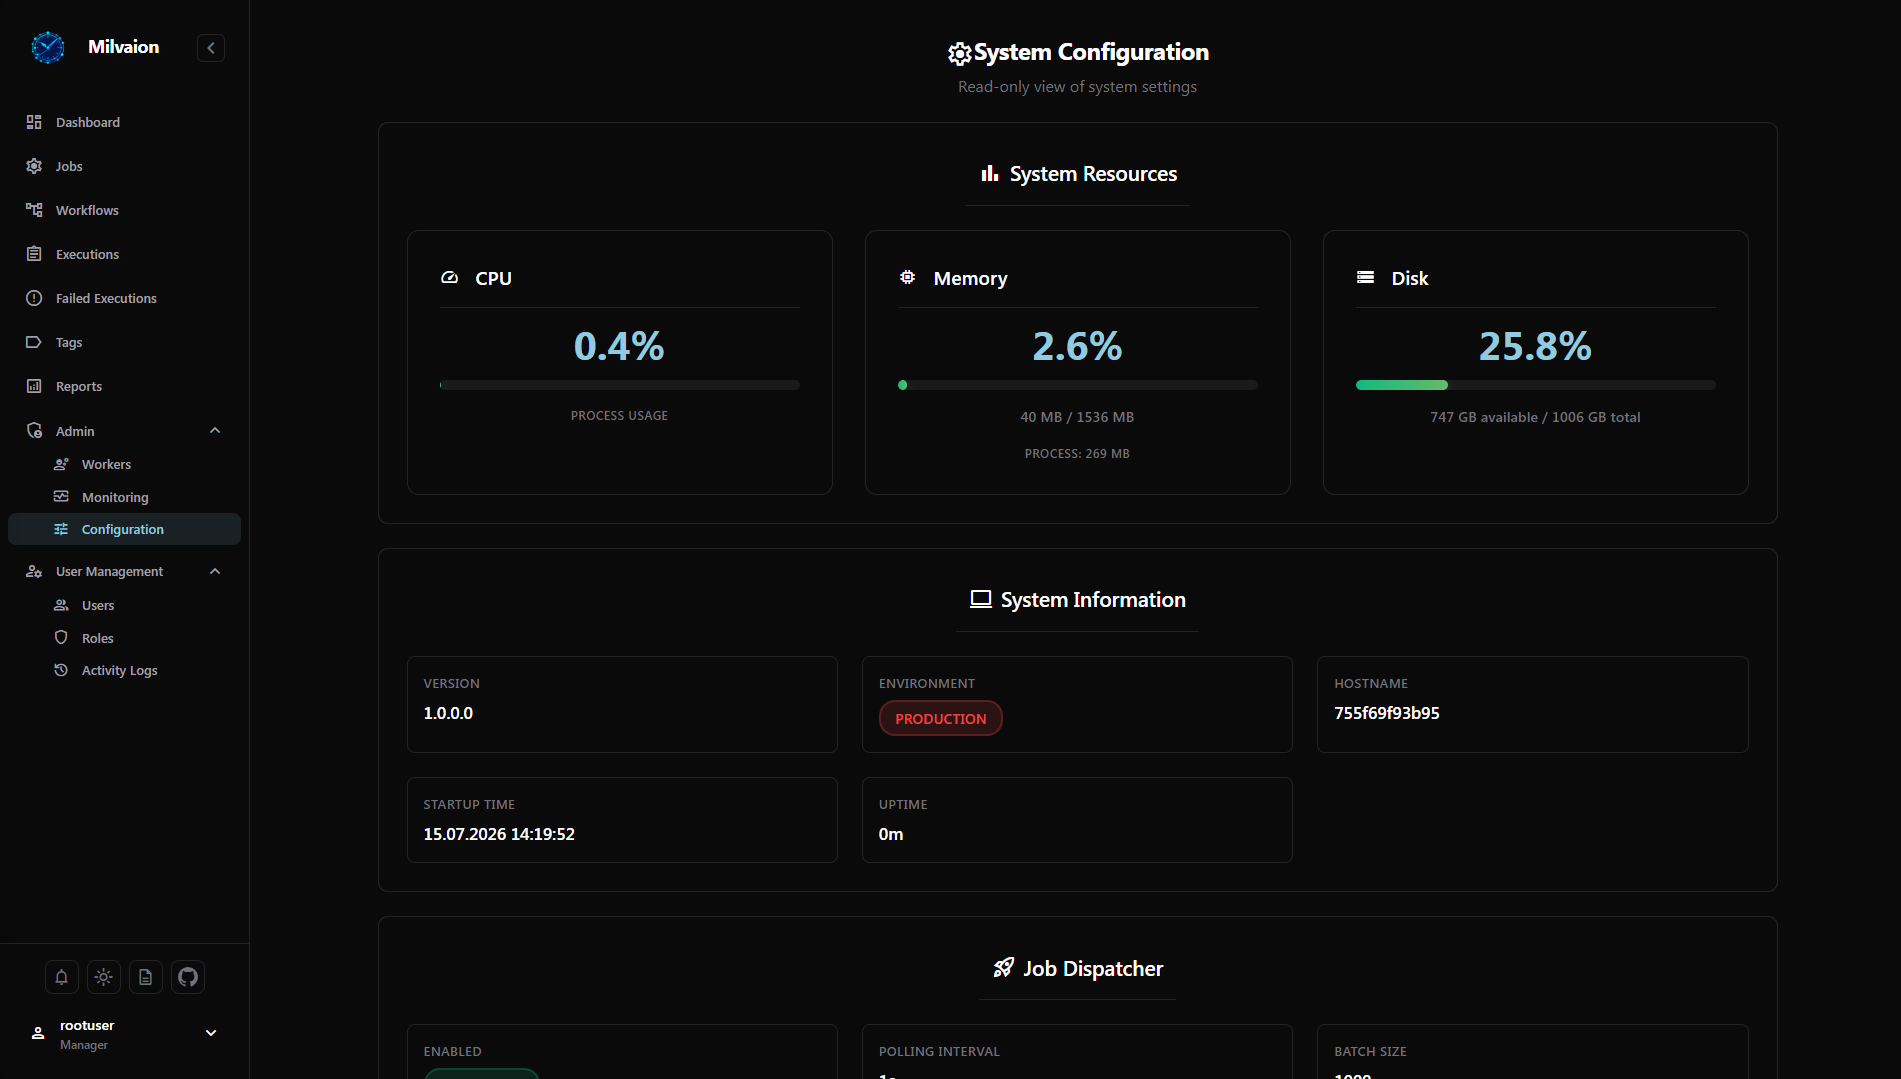
System Configuration
View and manage system settings.
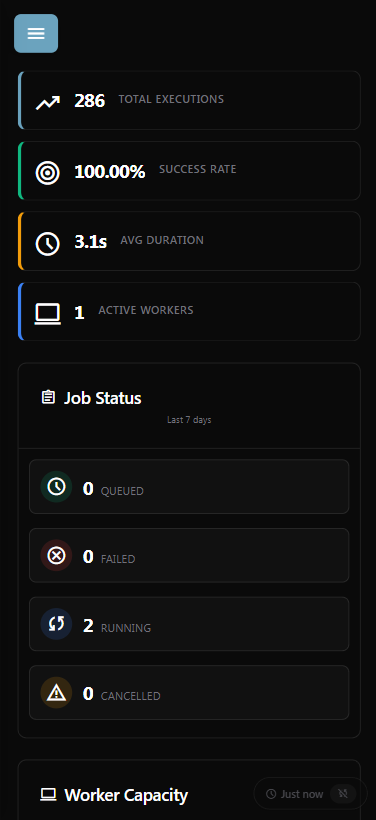
Mobile Responsive
The dashboard is fully responsive and works on mobile devices.